Fork/Join Framework vs. Parallel Streams vs. ExecutorService: The Ultimate Fork/Join Benchmark

How does the Fork/Join framework act under different configurations?
Just like the upcoming episode of Star Wars, there has been a lot of excitement mixed with criticism around Java 8 parallelism. The syntactic sugar of parallel streams brought some hype almost like the new lightsaber we’ve seen in the trailer. With many ways now to do parallelism in Java, we wanted to get a sense of the performance benefits and the dangers of parallel processing. After over 260 test runs, some new insights rose from the data and we wanted to share these with you in this post.
Fork/Join Framework vs. Parallel Streams vs. ExecutorService: The Ultimate Fork/Join Benchmark http://t.co/CMNfYZe58Z pic.twitter.com/6WExlmbyo6 — Takipi (@takipid) January 20, 2015
ExecutorService vs. Fork/Join Framework vs. Parallel Streams
A long time ago, in a galaxy far, far away.... I mean, some 10 years ago concurrency was available in Java only through 3rd party libraries. Then came Java 5 and introduced the java.util.concurrent library as part of the language, strongly influenced by Doug Lea. The ExecutorService became available and provided us a straightforward way to handle thread pools. Of course java.util.concurrent keeps evolving and in Java 7 the Fork/Join framework was introduced, building on top of the ExecutorService thread pools. With Java 8 streams, we’ve been provided an easy way to use Fork/Join that remains a bit enigmatic for many developers. Let’s find out how they compare to one another. We’ve taken 2 tasks, one CPU-intensive and the other IO-intensive, and tested 4 different scenarios with the same basic functionality. Another important factor is the number of threads we use for each implementation, so we tested that as well. The machine we used had 8 cores available so we had variations of 4, 8, 16 and 32 threads to get a sense of the general direction the results are going. For each of the tasks, we’ve also tried a single threaded solution, which you’ll not see in the graphs since, well, it took much much longer to execute. To learn more about exactly how the tests ran you can check out the groundwork section below. Now, let’s get to it.Indexing a 6GB file with 5.8M lines of text
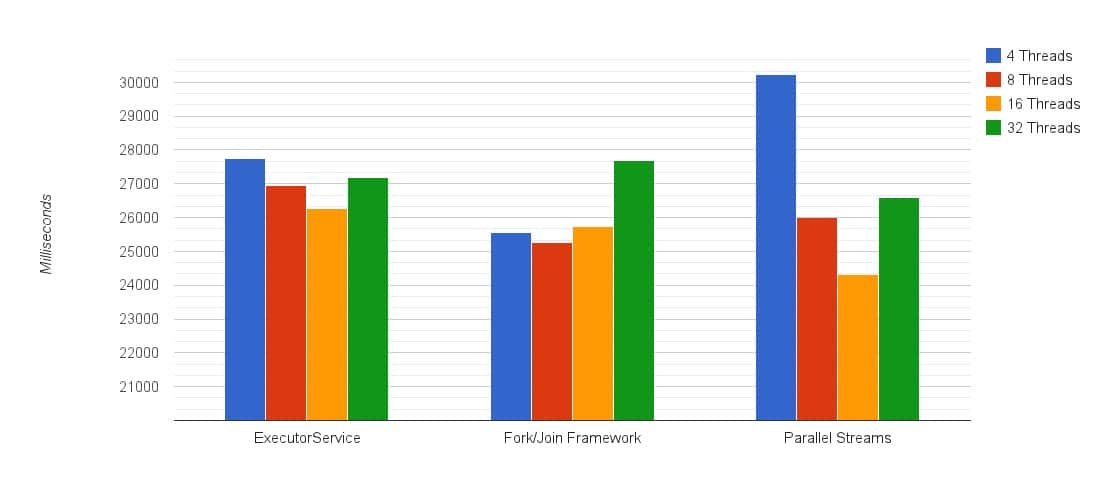
In this test, we’ve generated a huge text file, and created similar implementations for the indexing procedure. Here’s what the results looked like: ** Single threaded execution: 176,267msec, or almost 3 minutes.
** Notice the graph starts at 20000 milliseconds.
1. Fewer threads will leave CPUs unutilized, too many will add overhead
The first thing you notice in the graph is the shape the results are starting to take - you can get an impression of how each implementation behaves from only these 4 data points. The tipping point here is between 8 and 16 threads, since some threads are blocking in file IO, and adding more threads than cores helped utilize them better. When 32 threads are in, performance got worse because of the additional overhead.2. Parallel Streams are the best! Almost 1 second better than the runner up: using Fork/Join directly
Syntactic sugar aside (lambdas! we didn’t mention lambdas), we’ve seen parallel streams perform better than the Fork/Join and the ExecutorService implementations. 6GB of text indexed in 24.33 seconds. You can trust Java here to deliver the best result.3. But… Parallel Streams also performed the worst: The only variation that went over 30 seconds
This is another reminder of how parallel streams can slow you down. Let’s say this happens on machines that already run multithreaded applications. With a smaller number of threads available, using Fork/Join directly could actually be better than going through parallel streams - a 5 second difference, which makes for about an 18% penalty when comparing these 2 together.4. Don’t go for the default pool size with IO in the picture
When using the default pool size for Parallel Streams, the same number of cores on the machine (which is 8 here), performed almost 2 seconds worse than the 16 threads version. That’s a 7% penalty for going with the default pool size. The reason this happens is related with blocking IO threads. There’s more waiting going on, so introducing more threads lets us get more out of the CPU cores involved while other threads wait to be scheduled instead of being idle. How do you change the default Fork/Join pool size for parallel streams? You can either change the common Fork/Join pool size using a JVM argument: [java] -Djava.util.concurrent.ForkJoinPool.common.parallelism=16 [/java] (All Fork/Join tasks are using a common static pool the size of the number of your cores by default. The benefit here is reducing resource usage by reclaiming the threads for other tasks during periods of no use.) Or... You can use this trick and run Parallel Streams within a custom Fork/Join pool. This overrides the default use of the common Fork/Join pool and lets you use a pool you’ve set up yourself. Pretty sneaky. In the tests, we’ve used the common pool.5. Single threaded performance was 7.25x worse than the best result
Parallelism provided a 7.25x improvement, and considering the machine had 8 cores, it got pretty close to the theoretic 8x prediction! We can attribute the rest to overhead. With that being said, even the slowest parallelism implementation we tested, which this time was parallel streams with 4 threads (30.24sec), performed 5.8x better than the single threaded solution (176.27sec).What happens when you take IO out of the equation? Checking if a number is prime
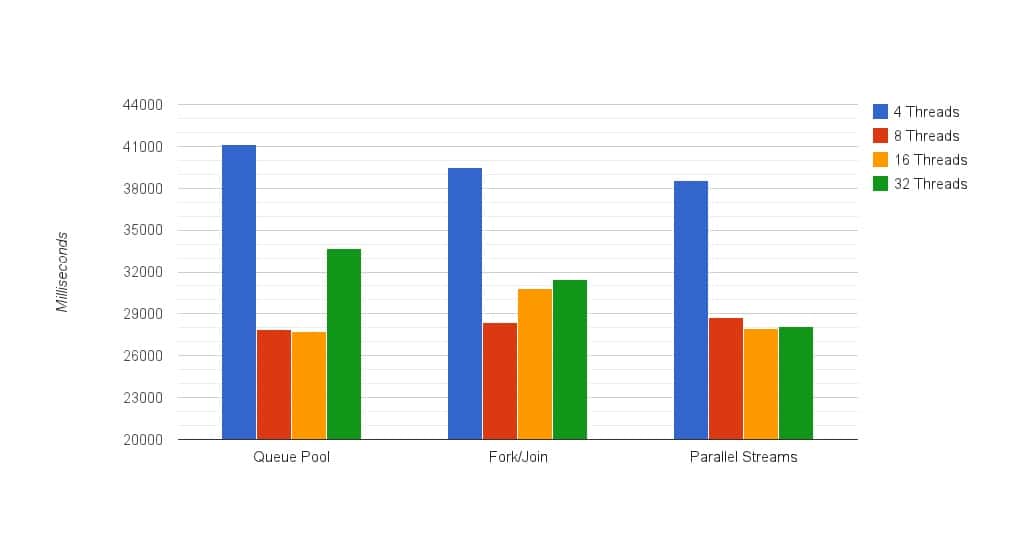
For the next round of tests, we’ve eliminated IO altogether and examined how long it would take to determine if some really big number is prime or not. How big? 19 digits. 1,530,692,068,127,007,263, or in other words: one quintillion seventy nine quadrillion three hundred sixty four trillion thirty eight billion forty eight million three hundred five thousand thirty three. Argh, let me get some air. Anyhow, we haven’t used any optimization other than running to its square root, so we checked all even numbers even though our big number doesn’t divide by 2 just to make it process longer. Spoiler alert: it’s a prime, so each implementation ran the same number of calculations. Here’s how it turned out: ** Single threaded execution: 118,127msec, or almost 2 minutes.
** Notice the graph starts at 20000 milliseconds

