CloudFront Log Analysis Using the Logz.io ELK Stack
Content Delivery Networks (CDNs) play a crucial role in how the Web works today by allowing application developers to deliver content to end users with high levels of availability and performance.
Amazon Web Services users commonly use CloudFront — Amazon’s global CDN service that distributes content across 54 AWS edge locations (PoP).
CloudFront provides the option to create log files that contain detailed information on every user request that it receives. However, the volume, variety, and speed at which CloudFront generates log files present a significant challenge for detecting and mitigating CDN performance issues.
To overcome this challenge, a more complete and comprehensive logging solution is necessary for which the data can be centralized and analyzed with ease and speed. AWS monitoring services such as CloudTrail and CloudWatch allow you to access the CloudFront logging data, so one option is to integrate these services with a dedicated log management system.
In this article, we will describe how to use the Logz.io cloud-based ELK-as-a-Service to integrate with CloudFront logs and analyze application traffic. The ELK Stack (Elasticsearch, Logstash, and Kibana) is the world’s most popular open source log analysis platform and is ideal for Big Data storage and analysis.
Note, to follow the steps described here, you will need AWS and Logz.io accounts as well as some basic knowledge of AWS architecture.
Understanding the Logging Pipeline
Before we start, a few words on the logging process that we will employ to log CloudFront with the ELK Stack.
As shown in the diagram below, when a user requests a web page, the content is delivered from the nearest edge location. Each user request is logged in a predefined format that contains all of the requested information. We will then store all of the generated logs in an S3 bucket and configure our Logz.io account so that the data will ship into the ELK Stack for analysis.
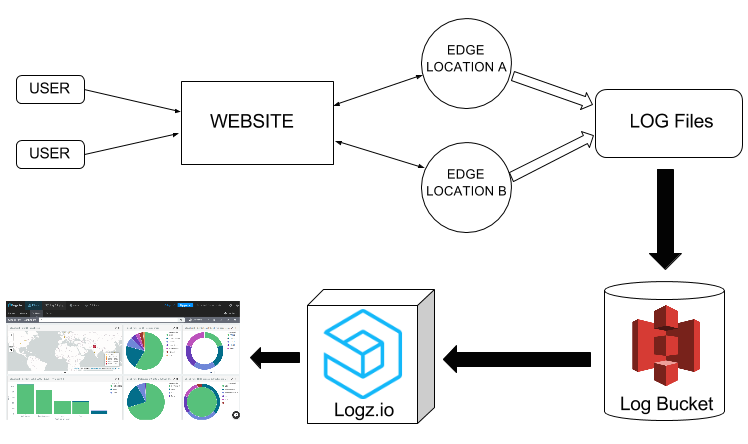
Workflow of log generation and shipping to Logz.io
CloudFront Web Distributions and Log Types
We’re almost there. But before we dive into the tutorial, it’s important to understand how CloudFront distributes content.
CloudFront replicates all files (from either an Amazon S3 bucket or any other content repository) to local servers at the edge locations. Using geo-aware DNS, Amazon CloudFront serves users from the nearest server to them. The content gets organized into web distributions in which each one has a unique CloudFront.net domain name that is used to access the content objects (such as media files, images, and videos) using the network of edge locations across the globe.
To create a CloudFront web distribution, you can use the CloudFront console. In the console, you will need to specify your origin server that stores the original version of the objects.
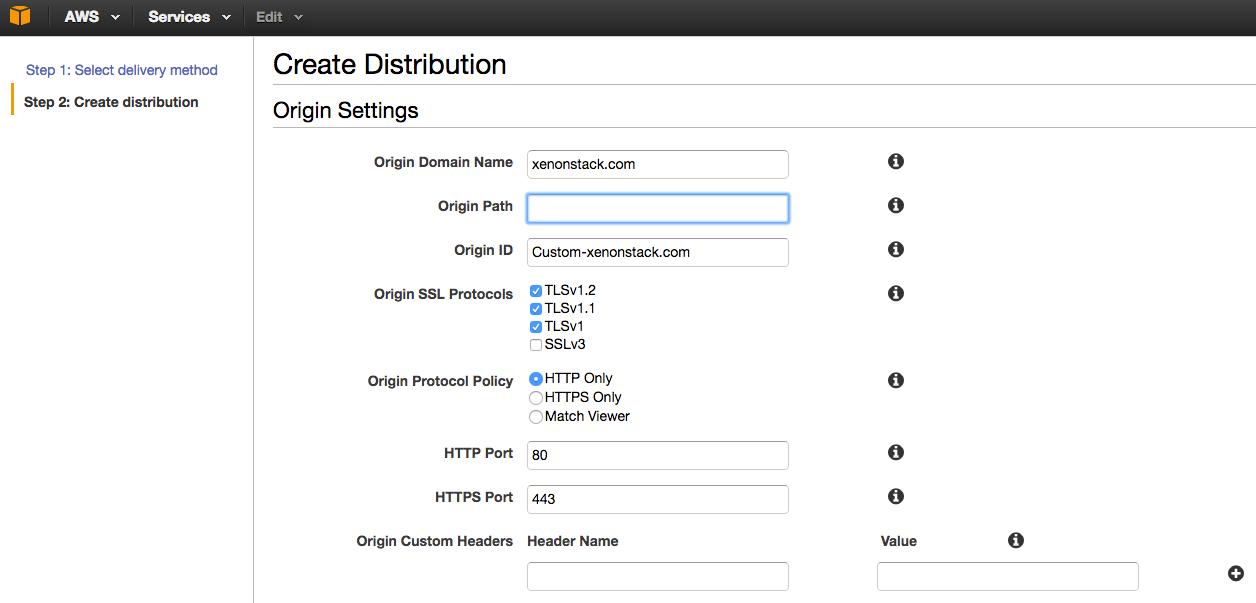
Create a CloudFront Distribution
This origin server can be an Amazon S3 bucket or a traditional web server. For example, if you’re using S3 as your origin server, you would need to supply the origin path in the format “yourbucketname.s3.amazonaws.com”.
You will then need to specify Cache Behavior Settings that will let you configure a variety of CloudFront functionalities for a given URL path pattern for pages on your website.
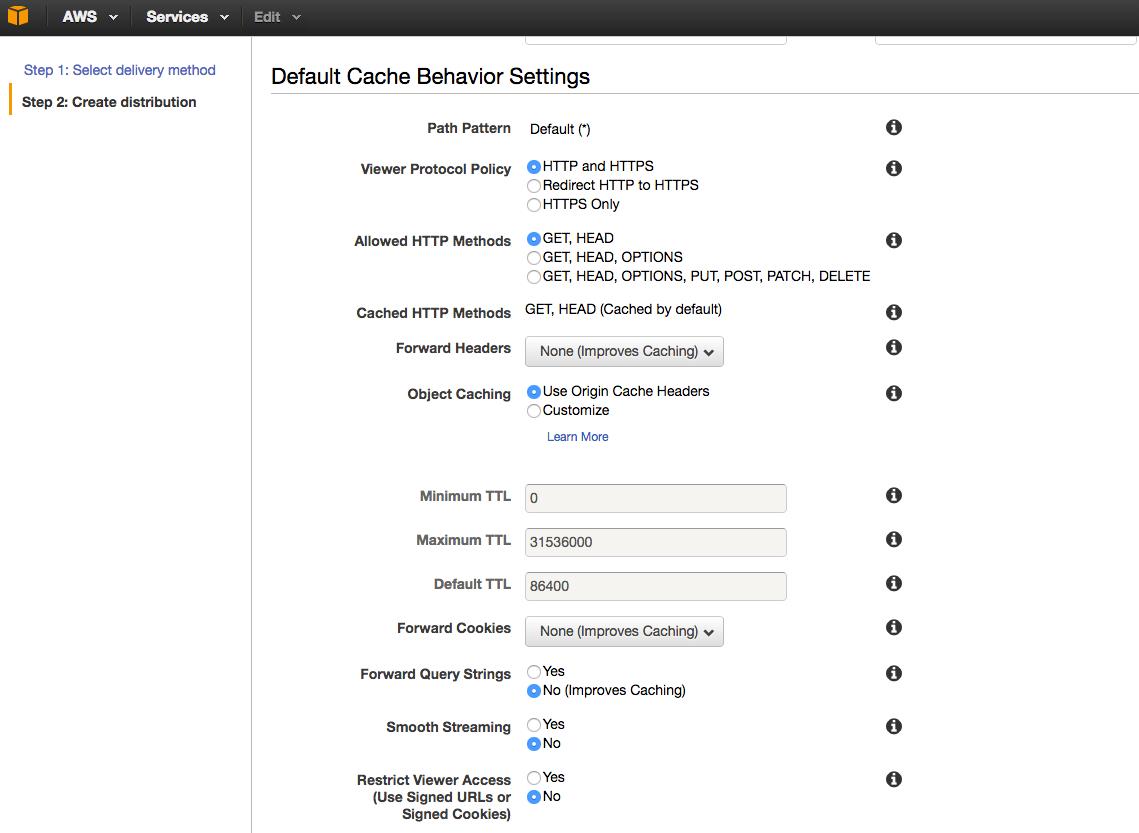
Default Cache Behavior Settings
Where necessary, you’ll also have to define your SSL Certificate and Alternate Domain Names (CNAMEs). You can read more here for further details on setting up a web distribution.
CloudFront Access Log Types
Web Distributions are used to serve static and dynamic content such as .html, .css, .php, and image files using HTTP or HTTPS. Once you’ve enabled CloudFront logging, each entry in a log file will supply details about a single user request. These logs are formatted in the W3C extended log file format.
There are two types of logs: Web Distribution and RTMP Distribution logs.
Web Distribution Logs
Each entry in a log file provides information about a specific user request. It comprises 24 fields that describe that request, as served through CloudFront. These fields include data such as date, time, x-edge-location, client-ip and cs-method. We can use, for example, the edge-location and client-ip to visualize the locations of the IP addresses in real time for proper traffic analysis.
RTMP Distribution Logs
RTMP (Real-Time Messaging Protocol) distributions are used for streaming media files with Adobe Media Server and the Adobe RTMP. The log fields in the RTMP distribution include playback events such as connect, play, pause, stop, and disconnect. These logs are generated each time that a user watches a video, and include stream name and stream ID fields.
If you want to learn more about CloudFront Access Logs then you can find detailed information in the AWS documentation.
Step-by-Step Guide
Now that we’ve learned a bit about how CloudFront works, it’s time to get down to business.
1. Enabling CloudFront Logging
To generate your user request logs, you’ll have to enable logging in CloudFront and specify the Amazon S3 bucket in which you want CloudFront to save your files (as shown below).
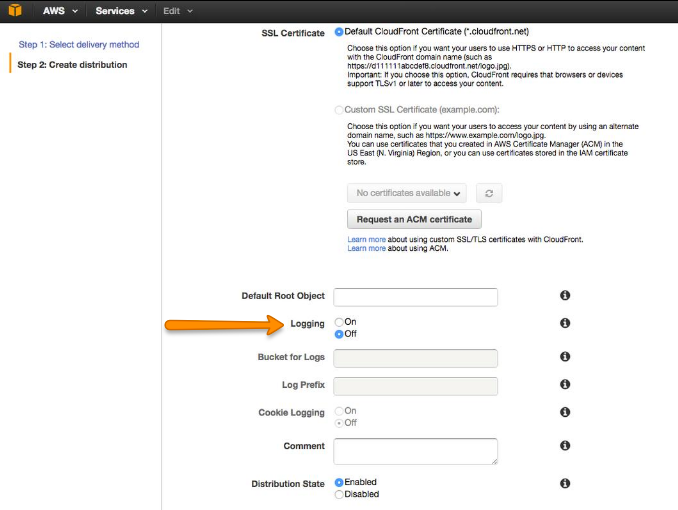
The logging radio button in your CloudFront distribution settings
You can also log several distributions into the same bucket. To distinguish logs from multiple distributions, you can specify an optional prefix for the file names.
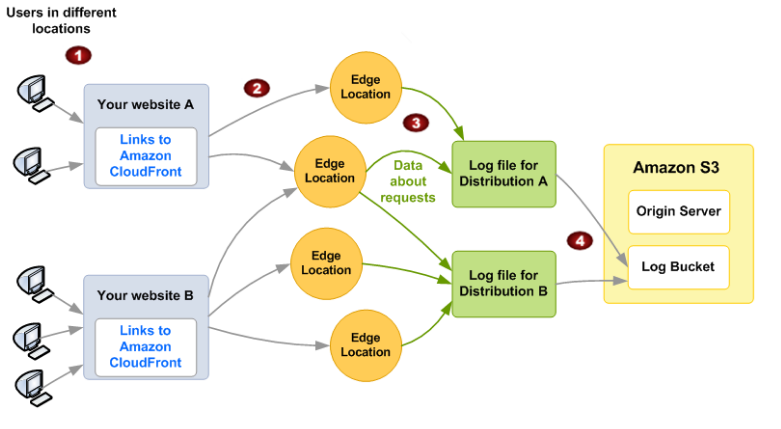
How CloudFront logs information about requests for your objects (image source: AWS)
2. Allowing Log Data Access
To allow the ELK stack to access the log data in your S3 bucket, your AWS user must define Amazon’s S3 FULL_CONTROL permission for the bucket. To do this, you should specify an IAM policy for the user along the lines of the following:
{
   "Version": "2012-10-17",
   "Statement": [
      {
      "Effect": "Allow",
      "Action": [
         "s3:ListBucket"
      ],
      "Resource": [
         "arn:aws:s3:::<BUCKET_NAME>"
      ]
   },
   {
      "Effect": "Allow",
      "Action": [
      "s3:GetObject"
   ],
   "Resource": [
      "arn:aws:s3:::<BUCKET_NAME>/*"
   ]
 }
]
}
Then, insert the code into the policy document in your AWS console to create this IAM policy:
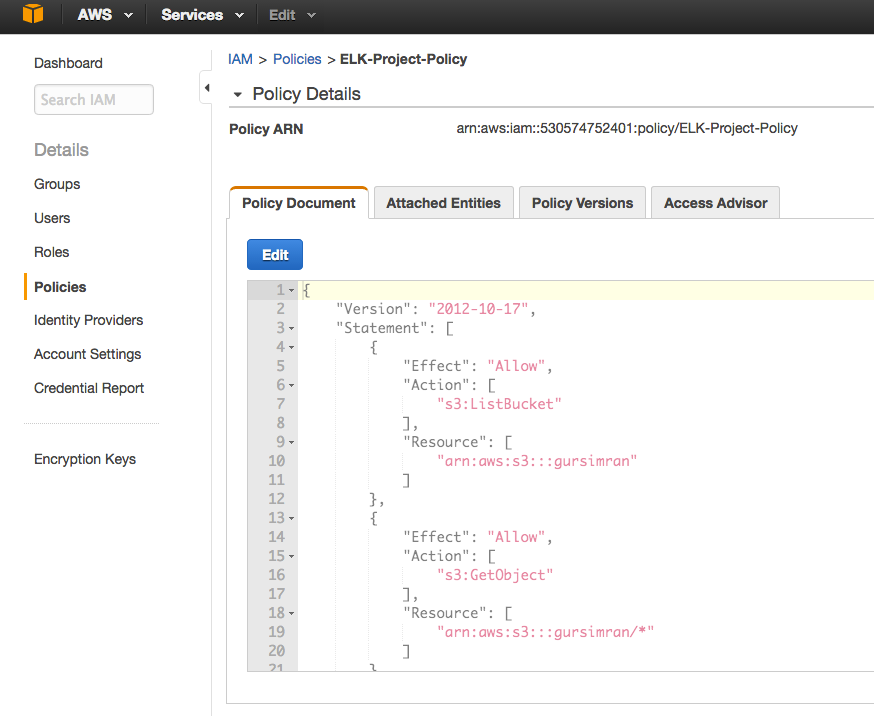
How to create a policy in IAM
If you’re having trouble getting logs from S3, just follow this troubleshooting guide.
3. Shipping Logs from S3 to Logz.io
Once you’ve made sure that CloudFront logs are being written to your S3 bucket, the process for shipping those logs into Logz.io is simple.
First, log into your Logz.io account and open the Log Shipping tab. Then, go to the AWS section and select “S3 Bucket.”
Next, enter the details of the S3 bucket from which you’d like to ingest log files. As shown below, enter your bucket information into the appropriate fields and make sure that for log types, you select “other” in the dropdown and type “cloudfront.”
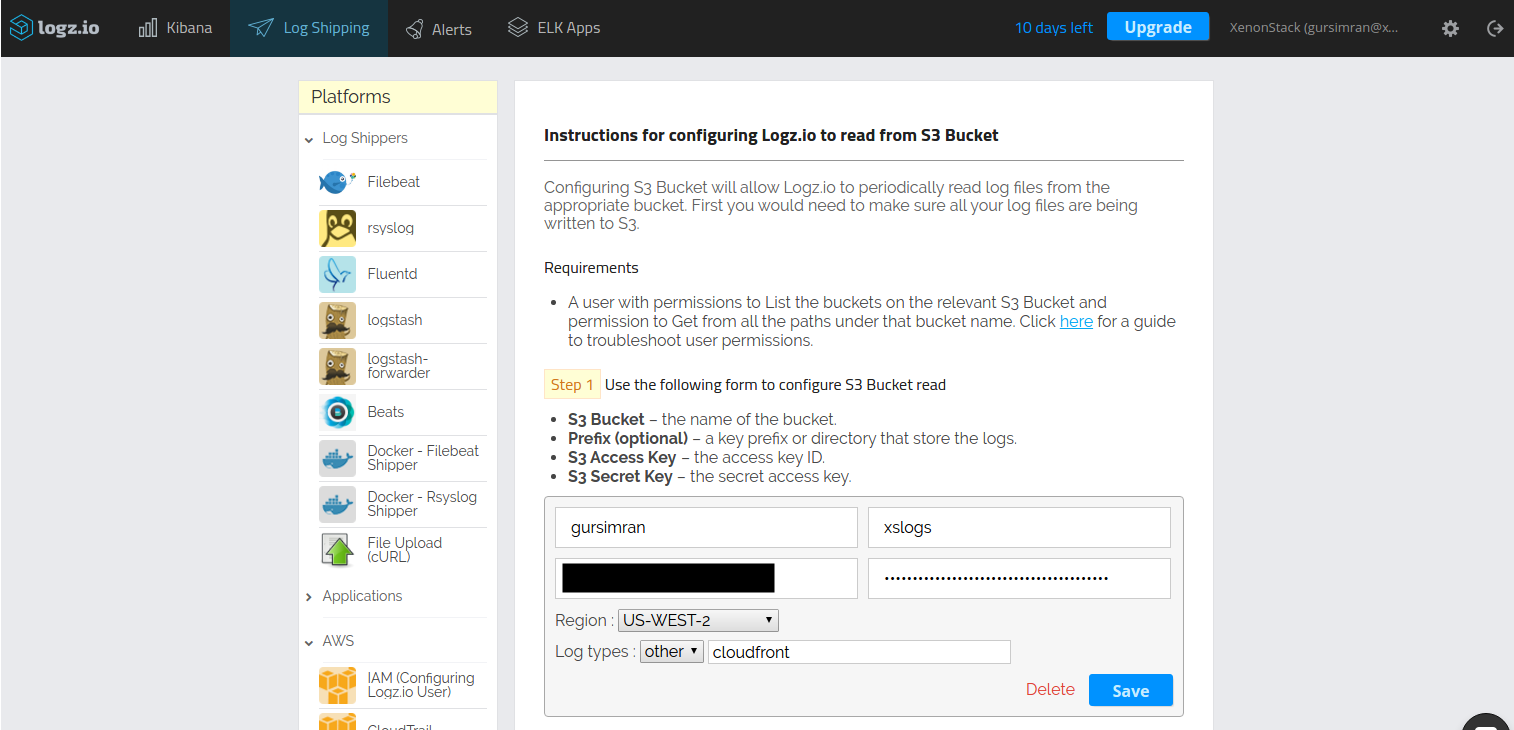
How to configure Logz.io to read from an S3 bucket
4. Building Your Dashboard
When you open Kibana, you should be able to see CloudFront log data displayed:
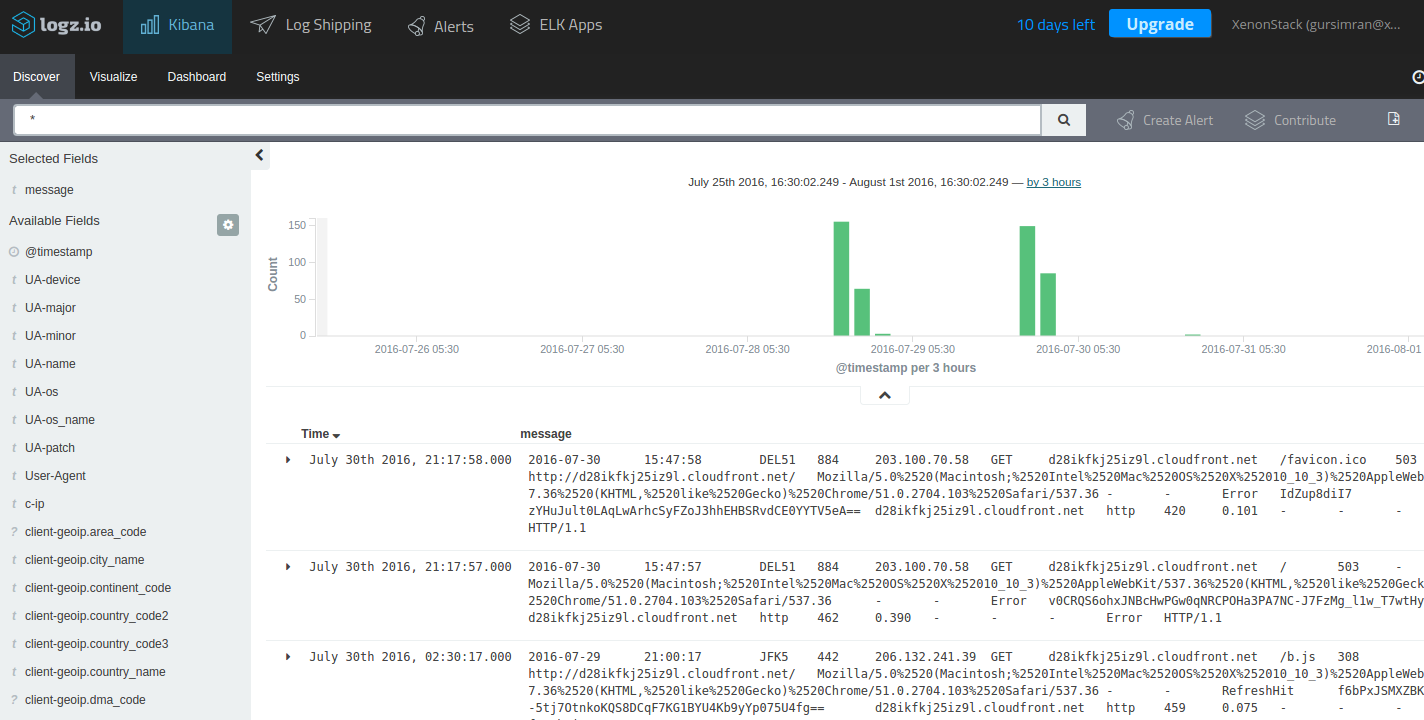
The Kibana discover tab
If you do not see any log data, it may be because the default logs interval is too short. However, you can adjust to a larger interval, if necessary.
Once you can see your logs, you can query them by typing a search in the query bar (more about querying Kibana in this video).
The Logz.io cloud-based ELK Stack comes with a number of handy additional features. One of these is ELK Apps, which is a free library of predefined searches, visualizations, and dashboards tailored for specific log analytics use cases — including CloudFront logs.
To install the CloudFront dashboard, simply search for ‘CloudFront’ on the ELK Apps page and hit the Install button. Once installed, you will be able to set up and use an entire CloudFront monitoring dashboard within seconds:
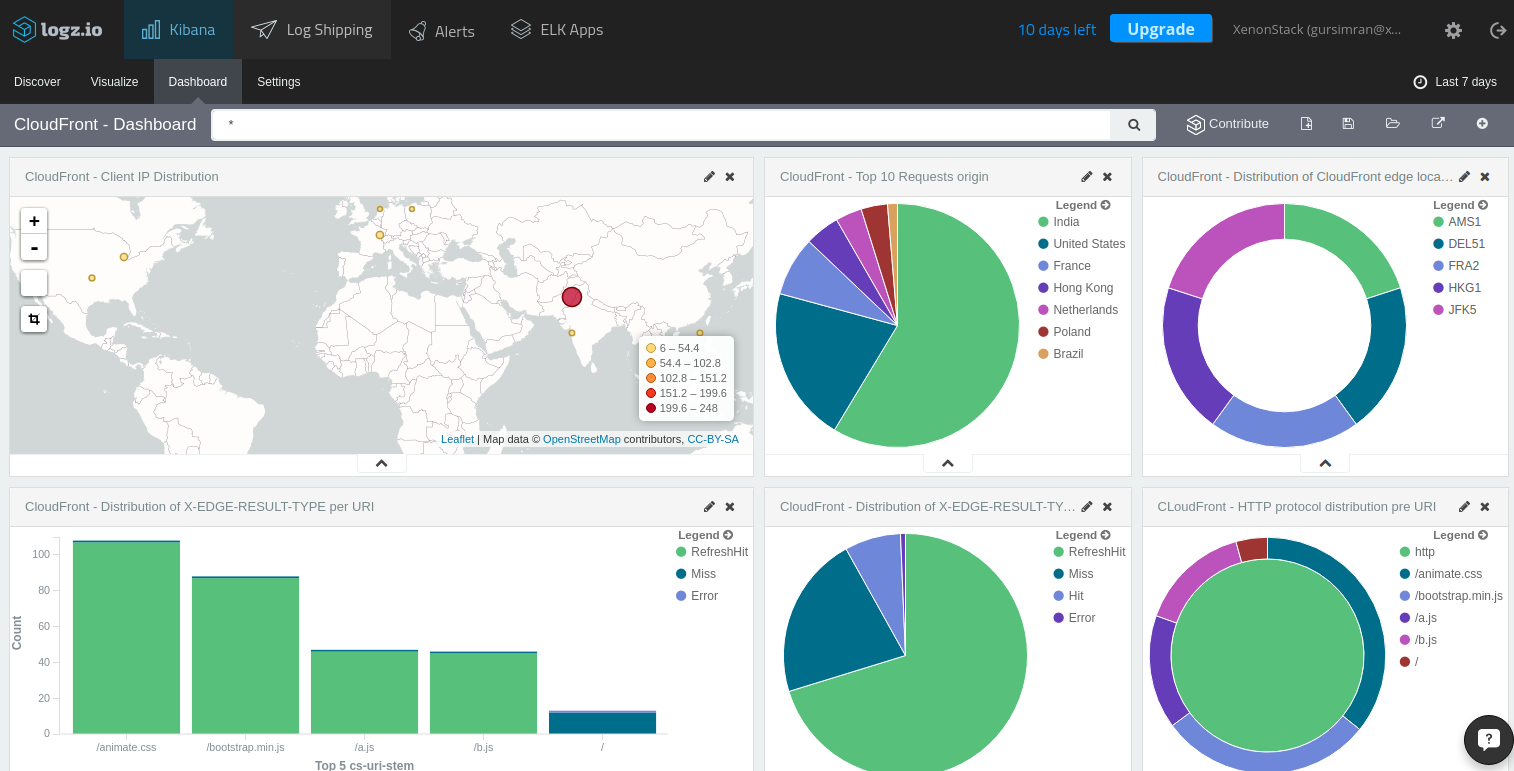
The CloudFront dashboard
In this dashboard, for example, you can visualize the different locations from where your website was accessed:
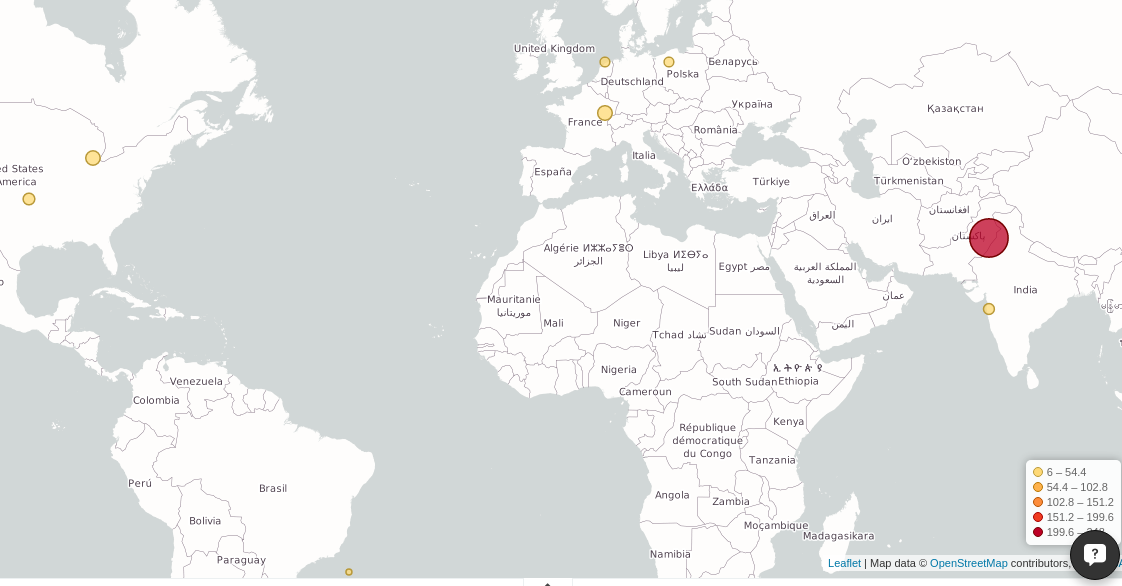
A geographic visualization showing the locations from where your website is accessed
It also provides a pie chart breakdown of your top 10 request origins and the protocols used for access as well as edge locations from where those requests were processed.
These are just a few simple examples of the available information. In total, there are twenty-four indexed fields with information that you can use to create visualizations to monitor your CloudFront logs.
A Final Note
CDNs have complex network footprints, so management and logging are crucial. However, not every developer has the option to collect all this data into an organized and digestible form. AWS provides a relatively simple way to use a CDN service, and combined with Logz.io, virtually any business can monitor their website traffic.

