O11y Guide, Cloud-Native Observability Pitfalls: The Protocol Jungle
Are you looking at your organization's efforts to enter or expand into the cloud-native landscape and feeling a bit daunted by the vast expanse of information surrounding cloud-native observability?
When you're moving so fast with agile practices across your DevOps, SREs, and platform engineering teams, it's no wonder this can seem a bit confusing.
Unfortunately, the choices being made have a great impact on both your business, your budgets, and the ultimate success of your cloud-native initiatives that hasty decisions upfront lead to big headaches very quickly down the road.
In the previous article, we discussed why so many practitioners are underestimating their existing landscape within cloud-native observability solutions. In this article, I'll share insights into the maze that is the protocol jungle and how it's causing us pain. By sharing common pitfalls in this series, the hope is that we can learn from them.
We often get excited about the solutions we are designing and forget the fundamental decisions that are important to a longer-term scalable solution. Open standards should be the default, but it's obviously very easy to be led astray in the protocol jungle when we are designing our cloud-native observability solutions.
Choosing the Right Path
The fundamental question is: Are we going to keep our options open and apply open source in our observability architecture? While I've talked a lot over my career about how the default for me is always open, in the world of cloud-native, it was not always possible to find open standards to apply.
When containers first broke into the cloud-native environments, the tooling being provided did not follow any accepted standard. To rectify this issue, the surrounding user community (and vendors) developed the Open Container Initiative (OCI) to ensure all future implementations would adhere to a common standard.
The same cycle continued with cloud-native observability and the community rallies to this day around the collection of projects under the Cloud Native Computing Foundation (CNCF). While many of the vendors in the observability landscape are coming from the second generation where Application Performance Monitoring (APM) solutions were implemented using proprietary languages and protocols, the community quickly searched for a path to standardization.
It goes without saying that investing in proprietary observability tooling that leverages closed standard protocols and query languages is only going to cause us pain down the road. Eventual pricing and limits in tooling functionality drive all organizations to continually evolve their solution architectures. When we've invested our time and extensive efforts using proprietary implementations, migration issues can seem almost insurmountable.
Let Open Guide Your Efforts
Many of the projects within the CNCF community have made efforts to standardize all things cloud-native observability. While not all are certified standards, many are so universally applied that they are the unofficial observability standards. Let's take a look at some of these standards and discover why open standards are the best guides for your observability efforts.
Prometheus
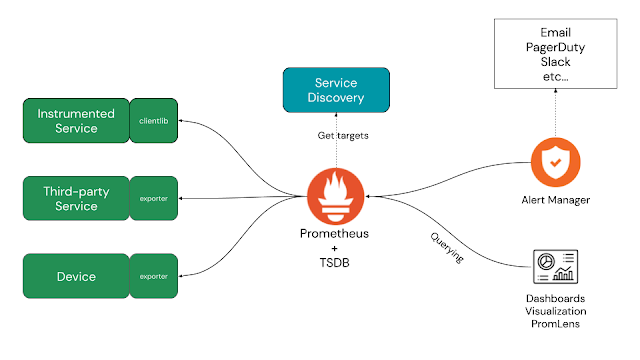
Prometheus is a graduated project under the CNCF and is defined as "considered stable and used in production." It's listed as a monitoring system and time series database, but the project site itself advertises that it is used to power your metrics and alert with the leading open-source monitoring solution.
.png)
Prometheus provides a flexible data model that allows you to identify time series data, which is a sequence of data points indexed in time order, by assigning a metric name. Time series are stored in memory and on a local disk in an efficient format. Scaling is done by functional sharing, splitting data across the storage, and federation.
The key standard here is that Prometheus uses a pull model to collect metrics data, scraping targets we define or it can automatically discover. This provides us with a powerful way to integrate our existing application and service landscape for observability data collection.
Leveraging the metrics data is done with a very powerful query language and the official project documentation states: "Prometheus provides a functional query language called PromQL (Prometheus Query Language) that lets the user select and aggregate time series data in real-time. The result of an expression can either be shown as a graph, viewed as tabular data in Prometheus's expression browser, or consumed by external systems via the HTTP API."
Interested in getting started with Prometheus and PromQL? Both can be explored hands-on with this free online workshop.
OpenTelemetry
This project, also known as OTel, is a fast-growing project with a focus on "high-quality, ubiquitous, and portable telemetry to enable effective observability."
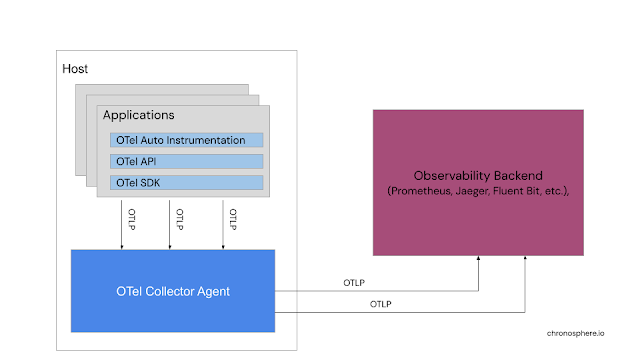
This project helps us to generate telemetry data from our applications and services, forwarding that in what is now considered a standard known as the OpenTelemetry Protocol (OTLP), to a variety of monitoring tools. To generate the telemetry data, you have to first instrument your code, but OTEL makes this very easy with automatic instrumentation through its integration with many existing languages.
Two things are of note here.
One is that OTel works on the principle of pushing telemetry data from our applications and services to OTel using collector agents on the host. This means that each application or service is pushing telemetry data we instrumented for using OTLP not only to the Otel Collector, but also is accepted into our backend storage platform of choice.
.png)
The second thing of note is that OTel does not provide any backend storage or query language, but instead provides the standard OTLP for existing backend platforms to ingest. This is one of the big values of using a standard so that we can change our backend observability tooling without breakage if it supports OTLP.
Fluent Bit
As stated in the official documentation, "Fluent Bit is an open-source telemetry agent specifically designed to efficiently handle the challenges of collecting and processing telemetry data across a wide range of environments, from constrained systems to complex cloud infrastructures. Managing telemetry data from various sources and formats can be a constant challenge, particularly when performance is a critical factor."
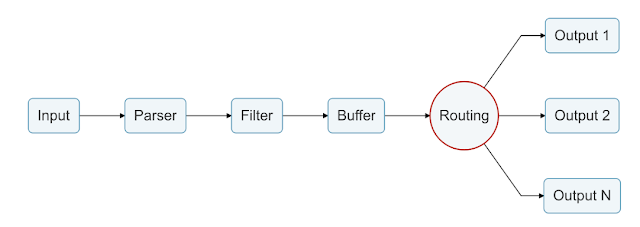
This is more than just a collector, it's able to adapt and optimize existing logging layers, as well as metrics and traces processing. As a CNCF project, it's designed to seamlessly integrate with other platforms such as Prometheus and OpenTelemetry. Fluent Bit uses standard TCP and HTTP for its outputs with vendors able to contribute plugins for their proprietary protocols and works with common data structures.

This is used for what is known as a data pipeline, able to receive, parse, filter, persist, and route to as many destinations as needed.
These are just a few examples of how we can keep our cloud-native observability options open and not get lost in a jungle of proprietary protocols. The road to cloud-native success has enough pitfalls and understanding how to avoid proprietary paths will save much wasted time and energy.
Coming Up Next
Another pitfall organizations struggle with in cloud native observability is the sneaky sprawling tooling mess. In the next article in this series, I'll share why this is a pitfall and how we can avoid it wreaking havoc on our cloud-native observability efforts.

