Analyze and Debug Quarkus-Based AWS Lambda Functions With X-Ray
Serverless architectures have emerged as a paradigm-shifting approach to building, fast, scalable, and cost-efficient applications. While serverless architectures provide unparalleled flexibility, they also introduce new challenges in terms of monitoring and troubleshooting.
In this article, we'll explore how Quarkus integrates with AWS X-Ray and how using a Jakarta CDI Interceptor can keep your code clean while adding custom instrumentation.
Quarkus and AWS Lambda
Quarkus is a Java-based framework tailored for GraalVM and HotSpot, which results in an amazingly fast boot time while having an incredibly low memory footprint. It offers near-instant scale-up and high-density memory utilization, which can be very useful for container orchestration platforms like Kubernetes or Serverless runtimes like AWS Lambda.
Building AWS Lambda Functions can be as easy as starting a Quarkus project, adding the quarkus-amazon-lambda dependency, and defining your AWS Lambda Handler function.
<dependency>
    <groupId>io.quarkus</groupId>
    <artifactId>quarkus-amazon-lambda</artifactId>
</dependency>
An extensive guide on how to develop AWS Lambda Functions with Quarkus can be found in the official Quarkus AWS Lambda Guide.
Enabling X-Ray for Your Lambda Functions
Quarkus provides out-of-the-box support for X-Ray, but you will need to add a dependency to your project and configure some settings to make it work with GraalVM/native compiled Quarkus applications.
Let's first start by adding the quarkus-amazon-lambda-xray dependency.
<!-- adds dependency on required x-ray classes and adds support for graalvm native -->
<dependency>
    <groupId>io.quarkus</groupId>
    <artifactId>quarkus-amazon-lambda-xray</artifactId>
</dependency>
Don't forget to enable tracing for your Lambda function otherwise, it won't work. An example of doing that is by setting the tracing argument to active within your AWS CDK code.
function = Function.Builder.create(this, "feed-parsing-function")
      ...
      .memorySize(512)
      .tracing(Tracing.ACTIVE)
      .runtime(Runtime.PROVIDED_AL2023)
      .logRetention(RetentionDays.ONE_WEEK)
      .build();
After the deployment of your function and a function invocation, you should be able to see the X-Ray traces from within the Cloudwatch interface. By default, it will show you some basic timing information for your function like the initialization and the invocation duration.

Adding More Instrumentation
Now that the dependencies are in place and tracing is enabled for our function, we can enrich the traces in X-Ray by leveraging the X-Ray SDKs TracingIntercepter . For instance, for the SQS and DynamoDB client, you can explicitly set the intercepter inside the application.properties file.
quarkus.dynamodb.async-client.type=aws-crt
quarkus.dynamodb.interceptors=com.amazonaws.xray.interceptors.TracingInterceptor
quarkus.sqs.async-client.type=aws-crt
quarkus.sqs.interceptors=com.amazonaws.xray.interceptors.TracingInterceptor
After putting these properties in place, redeploying, and executing the function, the TracingIntercepter will wrap around each API call to SQS and DynamoDB and store the actual trace information alongside the trace.

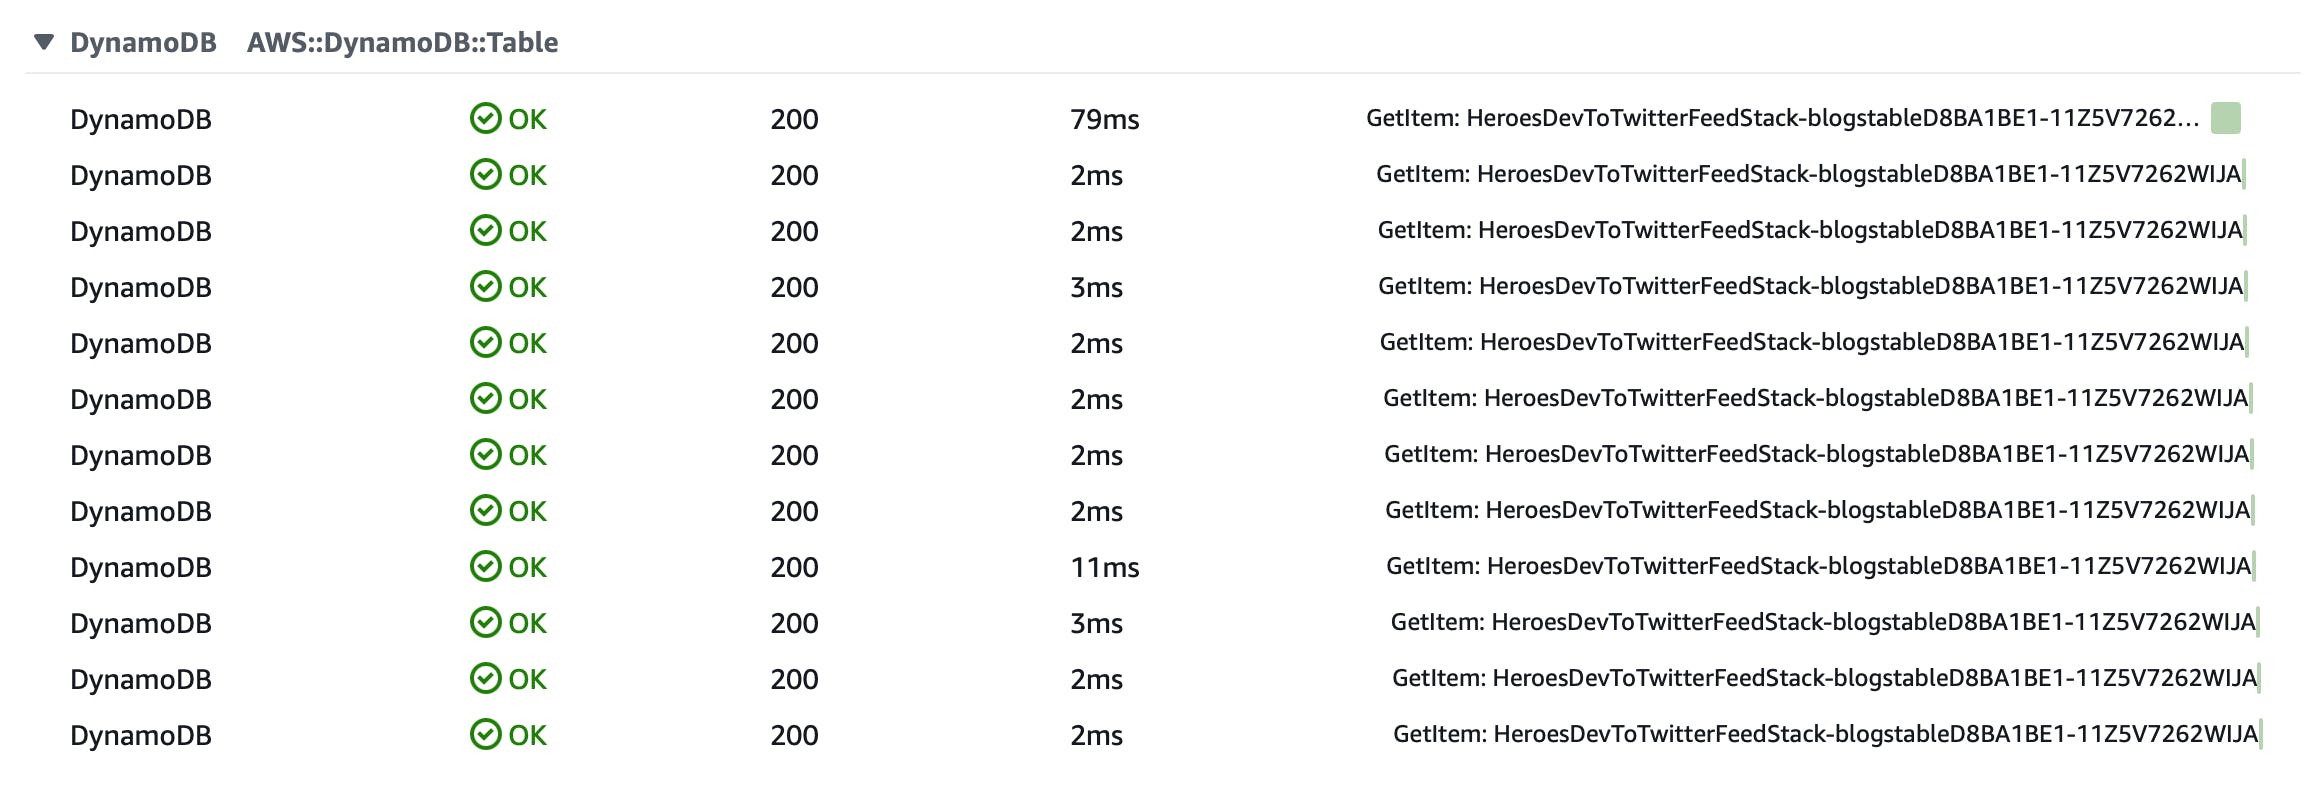
This is very useful for debugging purposes as it will allow you to validate your code and check for any mistakes. Requests to AWS Services are part of the pricing model, so if you make a mistake in your code and you make too many calls, it can become quite costly.

Custom Subsegments
With the AWS SDK TracingInterceptor configured, we get information about the calls to the AWS APIs, but what if we want to see information about our own code or remote calls to services outside of AWS?
The Java SDK for X-Ray supports the concept of adding custom subsegments to your traces. You can add subsegments to a trace by adding a few lines of code to your own business logic as you can see in the following code snippet.
public void someMethod(String argument)  {
  // wrap in subsegment
  Subsegment subsegment = AWSXRay.beginSubsegment("someMethod");
  try {
      // Your business logic
  } catch (Exception e) {
     subsegment.addException(e);
     throw e;
  } finally {
     AWSXRay.endSubsegment();
  }
}
Although this is trivial to do, it will become quite messy if you have a lot of methods you want to apply tracing to. This isn't ideal, and it would be better if we didn't have to mix our own code with the X-Ray instrumentation.
Quarkus and Jakarta CDI Interceptors
The Quarkus programming model is based on the Lite version of the Jakarta Contexts and Dependency Injection 4.0 specification. Besides dependency injection, the specification also describes other features like:
- Lifecycle Callbacks — A bean class may declare lifecycle
@PostConstructand@PreDestroycallbacks. - Interceptors — Used to separate cross-cutting concerns from business logic.
- Decorators — Similar to interceptors, but because they implement interfaces with business semantics, they are able to implement business logic.
- Events and Observers — Beans may also produce and consume events to interact in a completely decoupled fashion.
As mentioned, CDI Interceptors are used to separate cross-cutting concerns from business logic. As tracing is a cross-cutting concern, this sounds like a great fit. Let's take a look at how we can create an interceptor for our AWS X-Ray instrumentation.
How to Create an Interceptor for AWS X-Ray Instrumentation
We start with defining our interceptor binding, which we will call XRayTracing. Interceptor bindings are intermediate annotations that may be used to associate interceptors with target beans.
package com.jeroenreijn.aws.quarkus.xray;

import jakarta.annotation.Priority;
import jakarta.interceptor.InterceptorBinding;

import java.lang.annotation.Retention;

import static java.lang.annotation.RetentionPolicy.RUNTIME;

@InterceptorBinding
@Retention(RUNTIME)
@Priority(0)
public @interface XRayTracing {
}
The next step is to define the actual Interceptor logic, which is the code that will add the additional X-Ray instructions for creating the subsegment and wrapping it around our business logic.
package com.jeroenreijn.aws.quarkus.xray;

import com.amazonaws.xray.AWSXRay;
import jakarta.interceptor.AroundInvoke;
import jakarta.interceptor.Interceptor;
import jakarta.interceptor.InvocationContext;

@Interceptor
@XRayTracing
public class XRayTracingInterceptor {

    @AroundInvoke
    public Object tracingMethod(InvocationContext ctx) throws Exception {
        AWSXRay.beginSubsegment("## " + ctx.getMethod().getName());
        try {
            return ctx.proceed();
        } catch (Exception e) {
            AWSXRay.getCurrentSubsegment().addException(e);
            throw e;
        } finally {
            AWSXRay.endSubsegment();
        }
    }
}
An important part of the interceptor is the @AroundInvoke annotation, which means that this interceptor code will be wrapped around the invocation of our own business logic.
Now that we've defined both our interceptor binding and our interceptor, it's time to start using it. Every method that we want to create a subsegment for can now be annotated with the @XRayTracing annotation.
    @XRayTracing
    public SyndFeed getLatestFeed() {
        InputStream feedContent = getFeedContent();
        return getSyndFeed(feedContent);
    }

    @XRayTracing
    public SyndFeed getSyndFeed(InputStream feedContent) {
        try {
            SyndFeedInput feedInput = new SyndFeedInput();
            return feedInput.build(new XmlReader(feedContent));
        } catch (FeedException | IOException e) {
            throw new RuntimeException(e);
        }
    }
That looks much better. Pretty clean, if I say so myself.
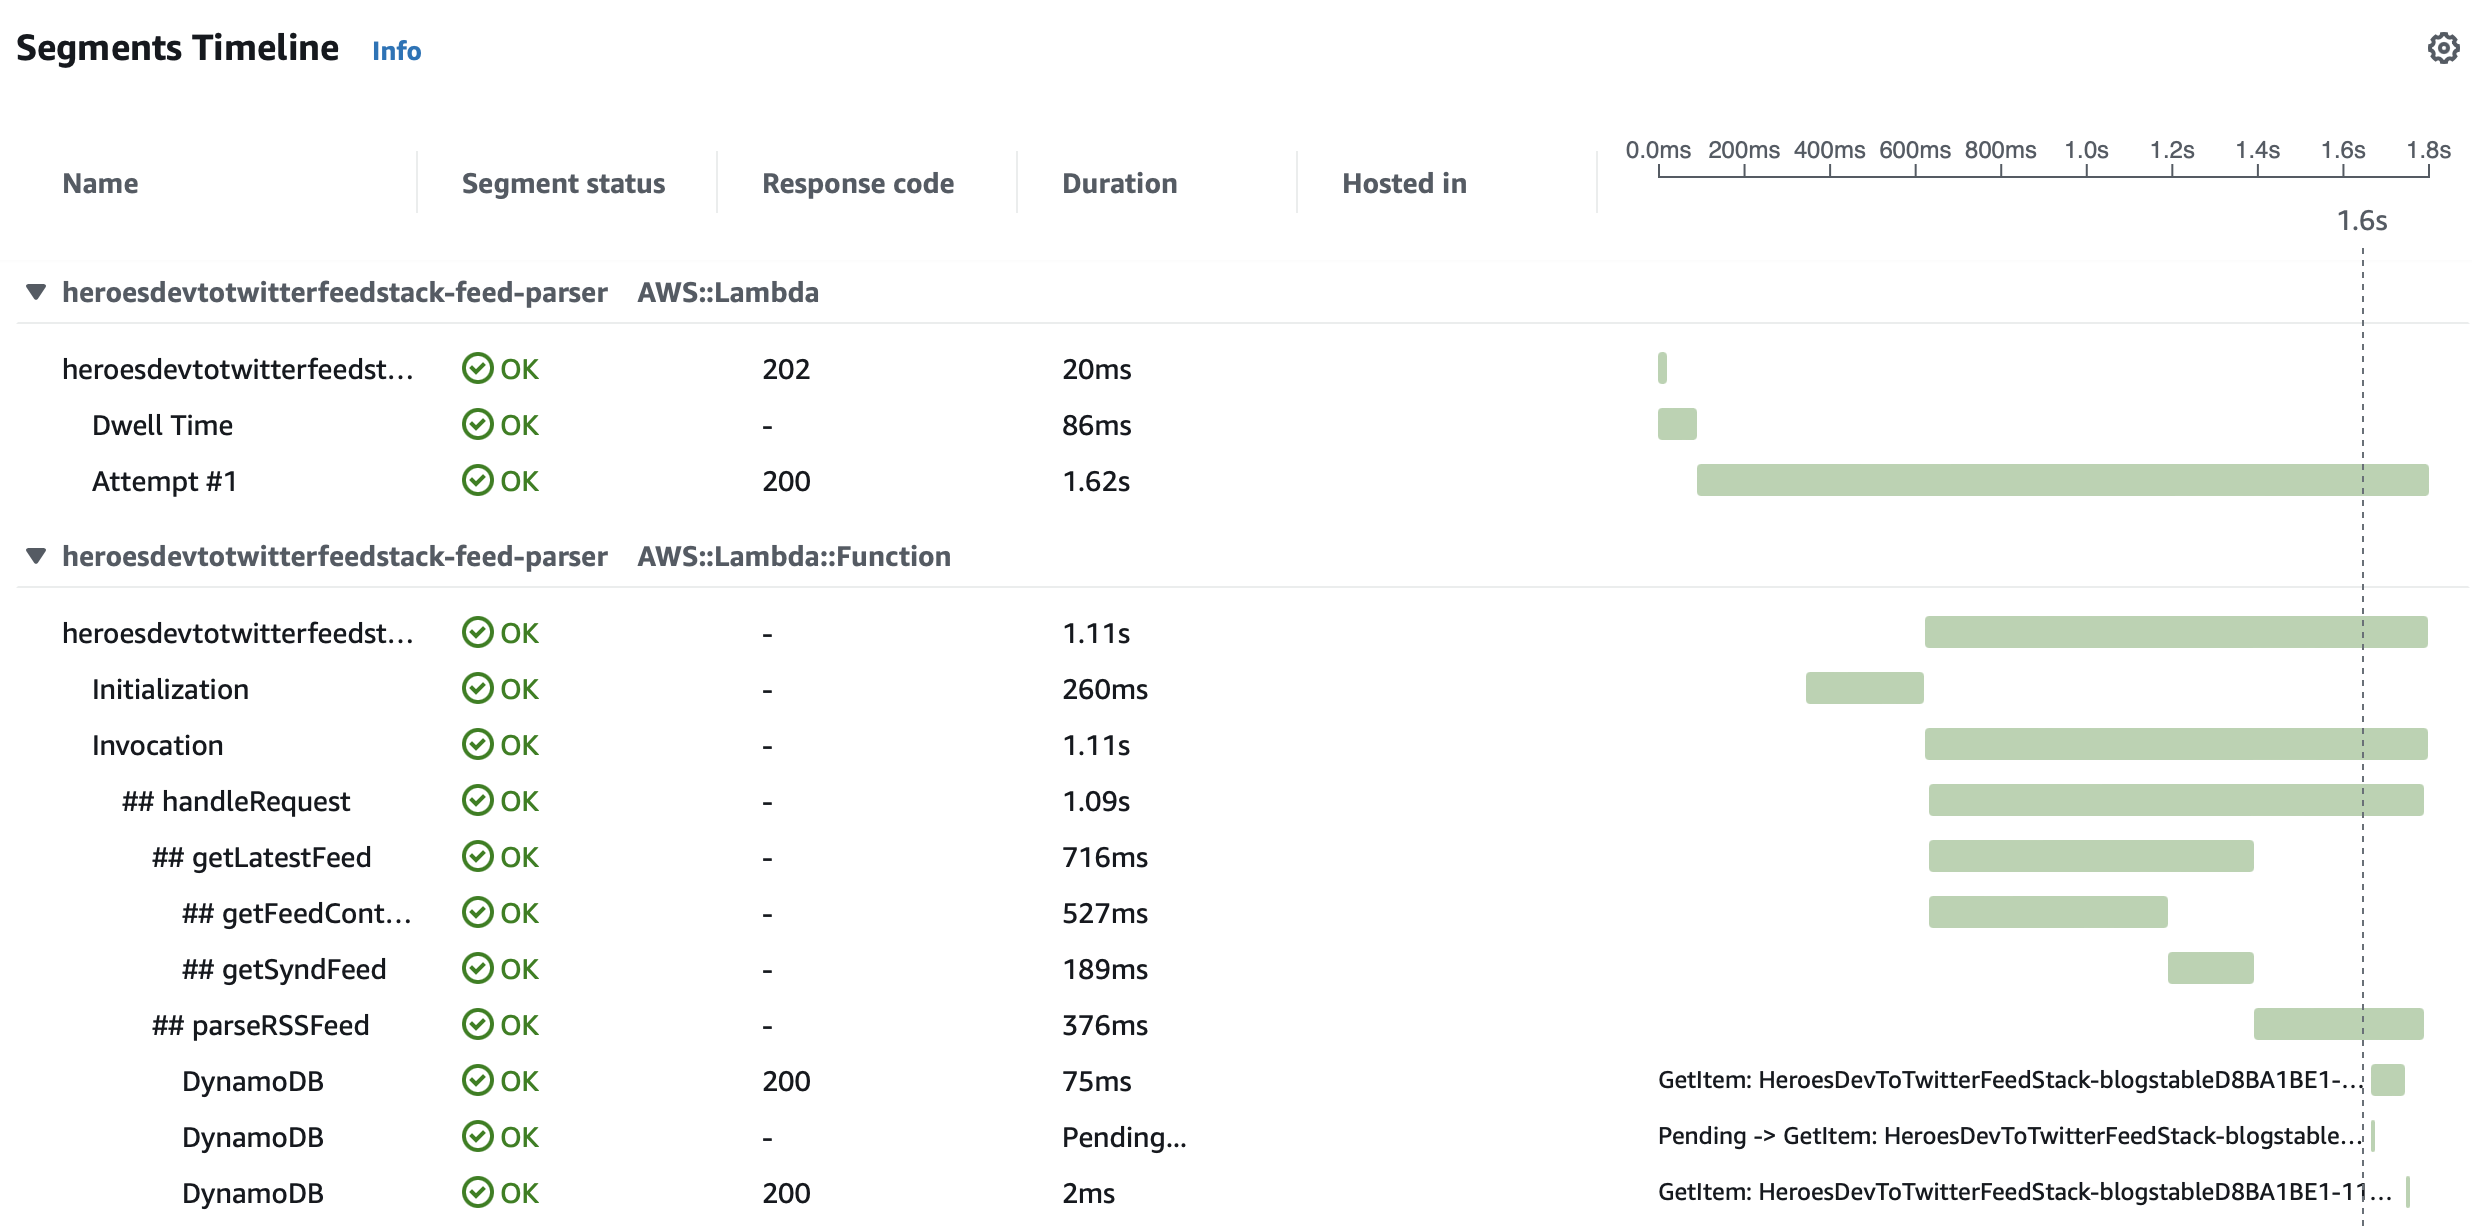
Based on the hierarchy of subsegments for a trace, X-Ray will be able to show a nested tree structure with the timing information.

Closing Thoughts
The integration between Quarkus and X-Ray is quite simple to enable. The developer experience is really good out of the box with defining the interceptors on a per-client basis. With the help of CDI interceptors, you can keep your code clean without worrying too much about X-Ray-specific code inside your business logic.
An alternative to building your own Interceptor might be to start using AWS PowerTools for Lambda (Java). Powertools for Java is a great way to boost your developer productivity, but it can be used for more than X-Ray, so I’ll save it for another post.

