Scalable Client-Server Communication With WebSockets and Spring Boot (Part II)
You can read part 1 here.
Secure WebSockets Over SSL/TLS
To prevent man-in-the-middle attacks between server and client, it is strongly recommended to use the WSS protocol, to send encrypted TCP messages. This is the equivalent of using HTTPS instead of HTTP.
Setting up NGINX
We will use NGNIX as a reverse proxy that forwards all incoming requests to the Spring Gateway MS. We will configure the proxy to listen to port 443 which is the default port for secure connections in both HTTPS/WSS.
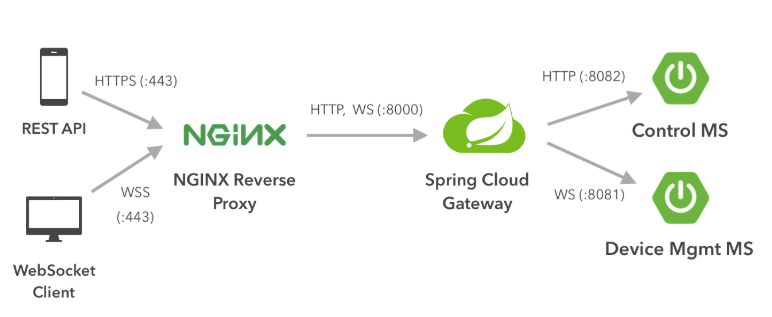
All requests to port 443 (WebSocket Secure or HTTPS connections) are routed to port 8000 of the gateway server. Note that behind the proxy server, all requests are sent unencrypted between the Microservices. This is acceptable, because these microservices are running on an isolated environment (internal network). However if the backend runs on different servers / locations, you may want to enable SSL on spring boot service level (and set up the proxy to forward the requests to secure ports) or use a VPN. Following is the NGNIX configuration:
xxxxxxxxxx
server {
listen 443 ssl;
listen 8080;
ssl_certificate /etc/asterisk/certs/example.crt;
ssl_certificate_key /etc/asterisk/certs/example.key;
ssl_session_timeout 5m;
ssl_protocols TLSv1 TLSv1.1 TLSv1.2;
ssl_ciphers HIGH:!aNULL:!MD5;
ssl_prefer_server_ciphers on;
location / {
# prevents 502 bad gateway error
proxy_buffers 8 32k;
proxy_buffer_size 64k;
# redirect all HTTP traffic to localhost:8000;
proxy_pass http://${GATEWAY}:8000;
proxy_set_header X-Real-IP $remote_addr;
proxy_set_header Host $http_host;
proxy_set_header X-Forwarded-For $proxy_add_x_forwarded_for;
#proxy_set_header X-NginX-Proxy true;
# enables WS support
proxy_http_version 1.1;
proxy_set_header Upgrade $http_upgrade;
proxy_set_header Connection "upgrade";
proxy_read_timeout 999999999;
}
}
The above example nginx.conf adds uses a certificate file named example.crt and a key file named example.key. Any certificate key-pair from a trusted source will work. Simply needs to be placed in a safe location that is accessible to NGINX. The acceptable protocols are explicitly set using the ssl_protocols directive, and the allowed ciphers are set with the ssl_ciphers directive. The two proxy_set_header directives are the ones responsible for upgrading the connection. Also, since WS and WSS connections support only HTTP 1.1, another directive called proxy_http_version sets the HTTP version to 1.1.
Server Sent Events
Server Sent Events (SSEs) is a server push technology enabling a client to receive automatic updates from a server via HTTP connection. Let's see why and how we could easily fit these as well is the solution.
The Asynchronous Reply Problem
In the previous article we discussed that the Control MS exposes a REST API, for the HTTP clients to use in order to send/receive data to/from smart devices. In the case of sending commands that return no results, the flow is simple: The Control MS receives the request, emits a message to Active MQ that gets picked up by Device Mgmt MS, which in turn sends the command to the smart device though the WebSocket channel. It is easy to see that this whole operation is asynchronous by nature, so how can we expect to reply to the synchronous HTTP client that started the operation in the first place? One way is to use WebSockets as well for the user-server communication and drop the REST API. However we wouldn’t recommend this approach because:
It would compromise the usability of the system (REST API’s are much more widely used than WebSocket endpoints).
It would require again some client work to be done (for example setting up a WebSocket client in JavaScript)
We don’t want a channel to be permanently open between the user’s device and the server. We only want to send a request and receive an asynchronous reply, without some persistent connection.
For these reasons we will be going with the SSE approach.
How SSE’s Work in Practice
When a client sends a request to an SSE endpoint, the server returns an Emitter object (in terms of Java). This leaves an open HTTP session, during which the server can send messages to the client. Once the connection is no longer needed, the server can drop the object, and it will be acknowledged by the client.
Let’s see how to implement this in our case:
Assume that the user wants to retrieve information from a temperature sensor in the living room:
The User sends an HTTP request to the /devices endpoint of the Control MS, which returns the emitter object.
The controller method on /device endpoint:
Java
xxxxxxxxxx115
12public SseEmitter sendCommandToDevice( ActionDTO actionDTO) {3log.info("Received POST request with body: {}", actionDTO);45/* Create Action event*/6ActionEvent event = ActionEvent.builder()7.destination(actionDTO.getDestination())8.command(actionDTO.getCommand())9.args(actionDTO.getArgs())10.id(UUID.randomUUID())11.build();1213messagingService.send(event);14return sseService.createPaymentEmitter(event.getId());15}
And the createPaymentEmitter method inside SseService.java class:Java
xxxxxxxxxx110
1private static Map<UUID, SseEmitter> currentEmitters = new ConcurrentHashMap<>();234public SseEmitter createPaymentEmitter(UUID transactionID) {5log.info("Start createPaymentEmitter with transactionID {}", transactionID);6SseEmitter emitter = new SseEmitter(1800000L);7emitter.onCompletion(() -> currentEmitters.remove(transactionID));8currentEmitters.put(transactionID, emitter);9return emitter;10}
The Control MS emits a message to the AMQ queue, to be picked up by Device Mgmt MS.
The Device Mgmt MS sends the command to the corresponding WebSocket client (Temperature sensor).
The WebSocket client replies with a message containing the data (in our case - temperature).
For the next steps, the Device Mgmt MS must send the data to the Control MS. Because Control MS will be running on multiple instances, we need to make sure that the message ends up in the instance that has the active connection with the User client. The most straightforward way to achieve this, is to use a Pub/Sub mechanism (e.g. Redis or JMS Topic in our case). So the flow continues like:
5. The Device Mgmt MS publishes the message to a Topic.
6. All instances of the Control MS receive the message.
7. Each checks in a local Emitter Map for the user that this message is directed to.
8. If found, send the message and remove the Emitter from the Map (since we won’t be sending any more messages)
xxxxxxxxxx
(destination = "${broker.topic}")
public void receive(ActionResultEvent message) {
log.info("received message='{}'", message);
var emitter = sseService.getEmitterMap().get(message.getTransactionId());
if (emitter == null)
log.info("No emitter found for this message: {}", message);
else {
try {
emitter.send("OK");
} catch (IOException e) {
log.info("Error while sending emitter data", e);
} finally {
emitter.complete();
}
}
}
Testing With Locust
We performed two types of tests: Idle WebSocket client tests, and testing under load produced by HTTP clients, using an open source load testing tool called Locust. With Locust, we can define user behavior in Python code and since we deal with WebSockets we needed such flexibility. Moreover, Locust tests can run distributed (in a master-slave mode) and since extended load testing and observability is crucial when it comes to WebSockets (for extra reasons compared to common applications as we will demonstrate), we wanted to be able to simulate large number of users and increase this number easily and on-demand.
The microservices and Locust clients (HTTP/ WebSocket) were deployed on Google Cloud platform in order to perform the tests. For Locust specifically, we configured 2 quad-core machines in order to run it distributed respecting the guidelines here.
Idle performance testing
In this scenario we stress test the system, when multiple idle clients are connected. Since we have WebSockets, the interaction is stateful. This means that we end up storing at least some data in memory on the WebSocket server(s) for each open client connection. Therefore, the metrics we should be checking are mainly: 1) the Java Heap, 2) the number of open files and 3) the performance of the message broker.
For monitoring the Spring Boot microservices, we use Prometheus and Grafana taking advantage of Micrometer. For measuring the broker’s performance we used the built-in Artemis Management Console and for this demo, we are going with Artemis configuration defaults.
Test #1: 5k WebSocket clients, 1 server instance with 1024MB max heap size (-Xmx)
Client-side, the test procedure is the following:
Initiate up to 5000 locusts, starting from 0 and incrementing by 20 users/second.
Each locust picks a unique username and initializes the WebSocket connection.
After the connection is successfully initiated, the client remains idle and sends a heartbeat every 20 seconds to keep the connection alive.
With this test we aimed to quantify the resources that the server needs to support those connections, which would be helpful when deciding how much memory to allocate/instances to have.
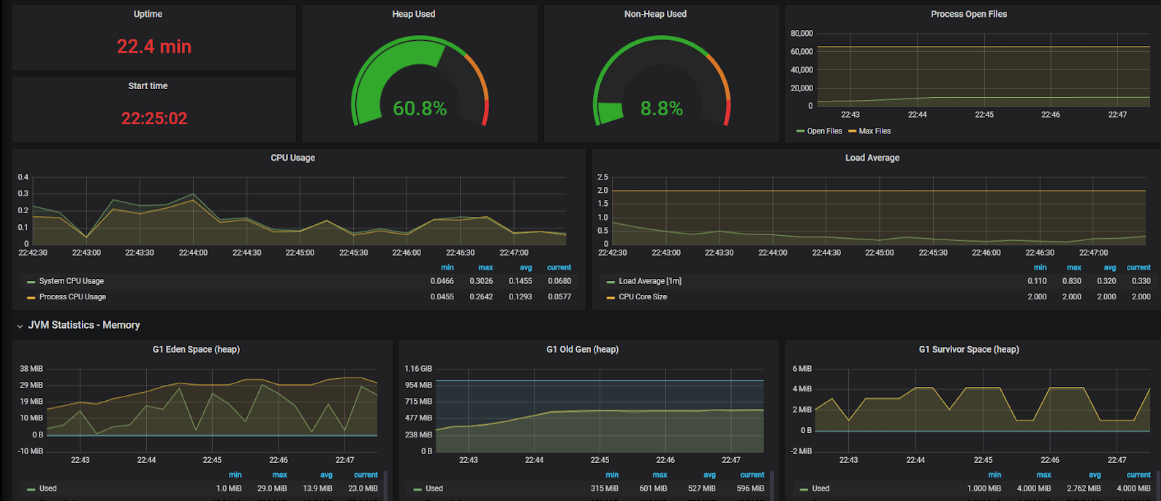
The JVM Heap utilization is about 60% of the total size, which would make it around 600 MB. The number of open files is also large (~10000). The CPU usage remains relatively low. Taking a look at the Artemis Management Console, we can verify that the CPU / Memory usage of the broker is small enough:
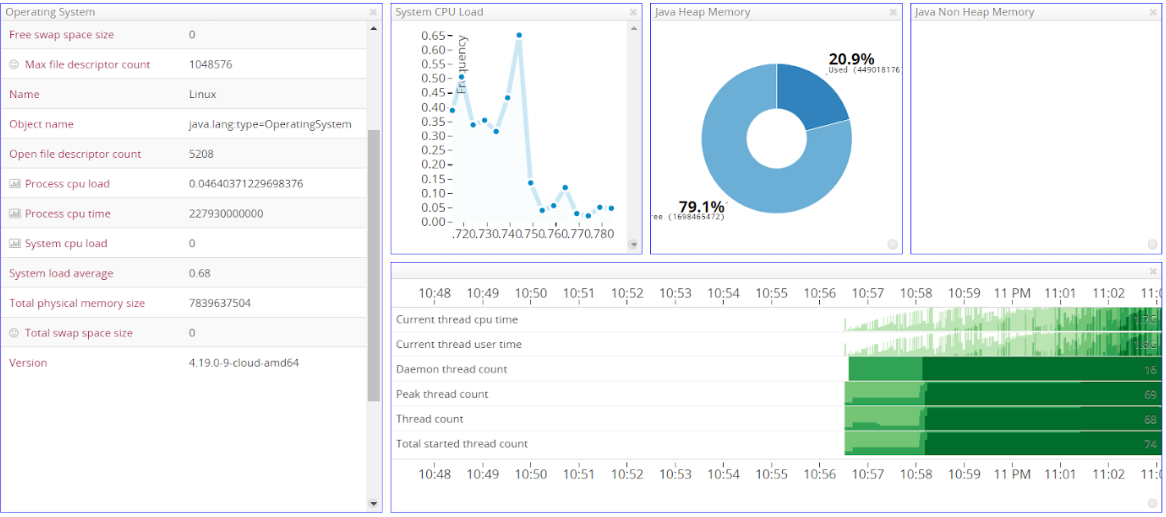
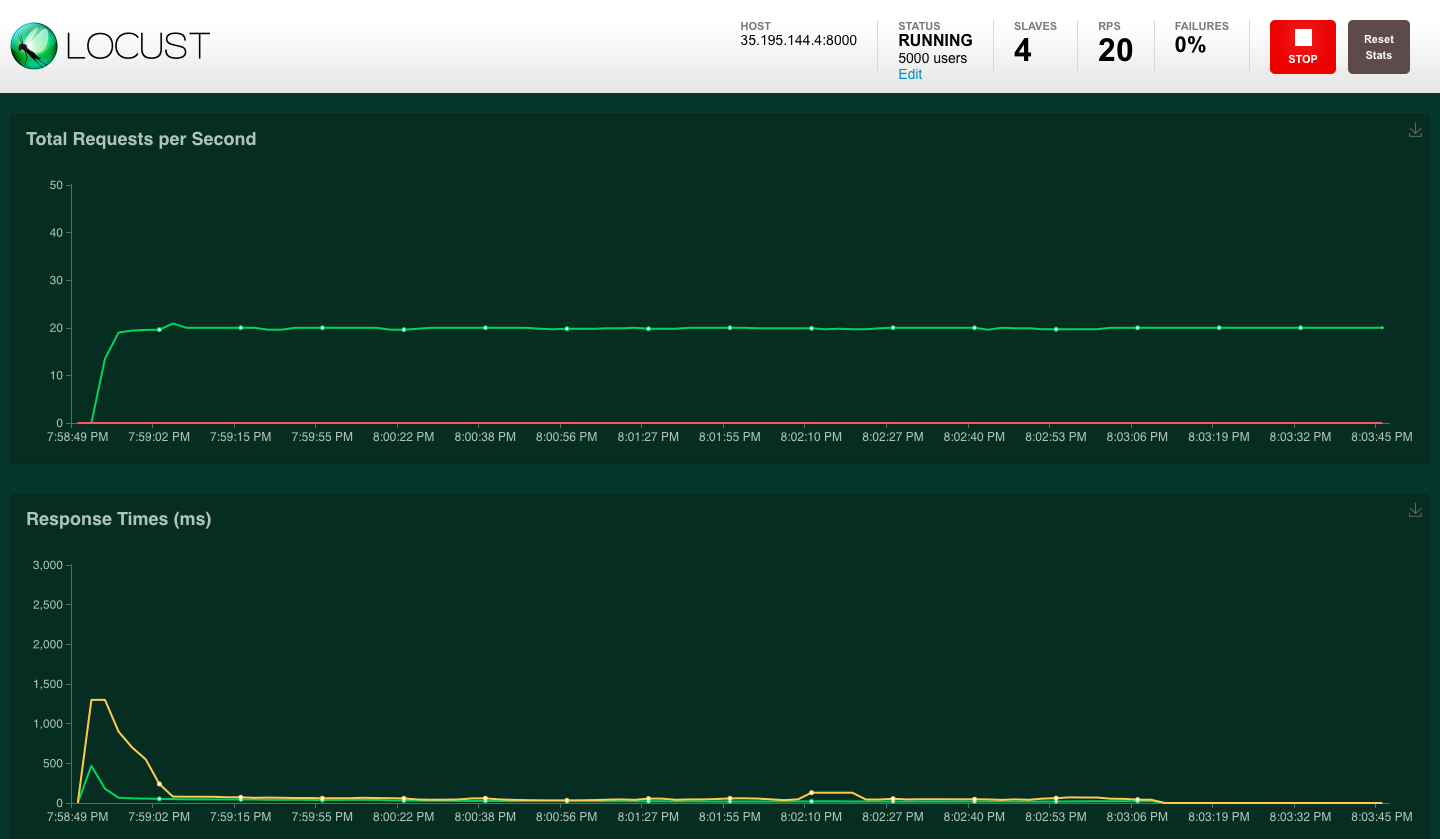 Locust UI - WebSocket requests per second and response times
In order to use Locust for simulating WebSocket clients, we used two other python modules:
- websocket_client: A low level WebSocket client for python
- stomper: An implementation of the STOMP protocol
Test #1 findings
The following factors require close monitoring and tuning:
- JVM heap size and memory allocation
- Increased limit of file handles on the servers: this is absolutely necessary not only for the Message Broker and the WebSocket server instances but for the Spring Cloud Gateway as well. In fact the Gateway's number of open files equals to the total number of open files of the WebSocket servers is proxies
- Purging of inactive queues: in Artemis there is no need to remove inactive queues manually. When the broker detects a terminated WebSocket, it automatically removes the corresponding queue. In case of other queues refer to the broker documentation.
Test #2: 10k WebSocket clients, 2 server instances with 1024MB max heap size (-Xmx)
In the next test, the WebSocket connections are doubled and we’re using two instances of the server. The default round-robin policy for load-balancing is being used and, as expected, the connections are divided equally across the two instances:
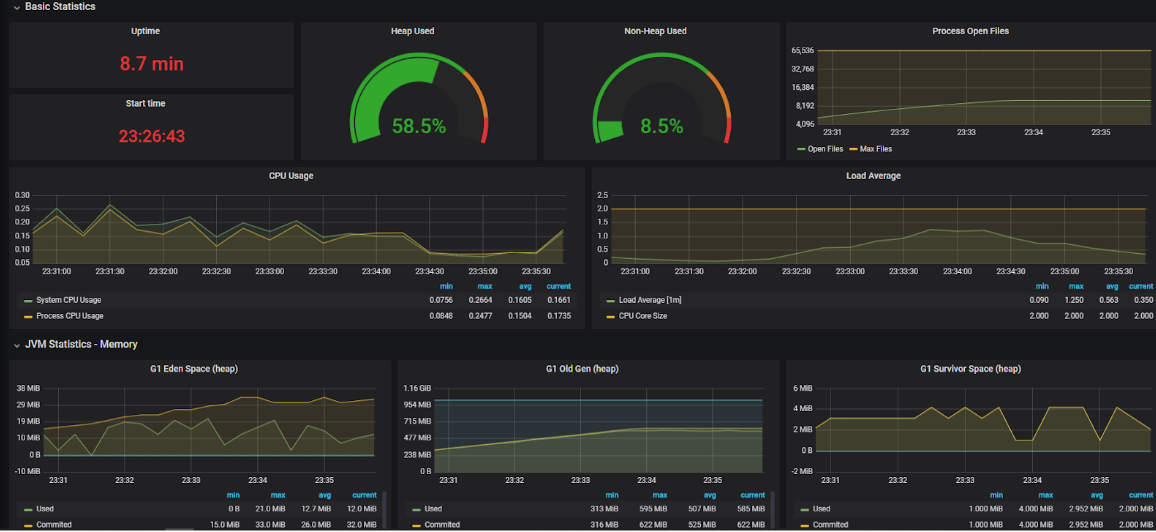
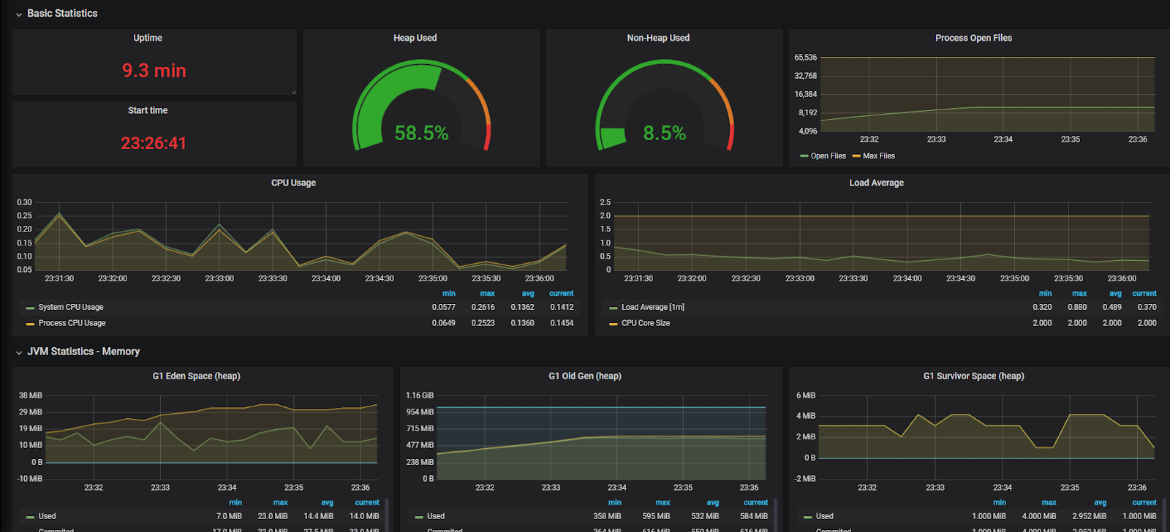
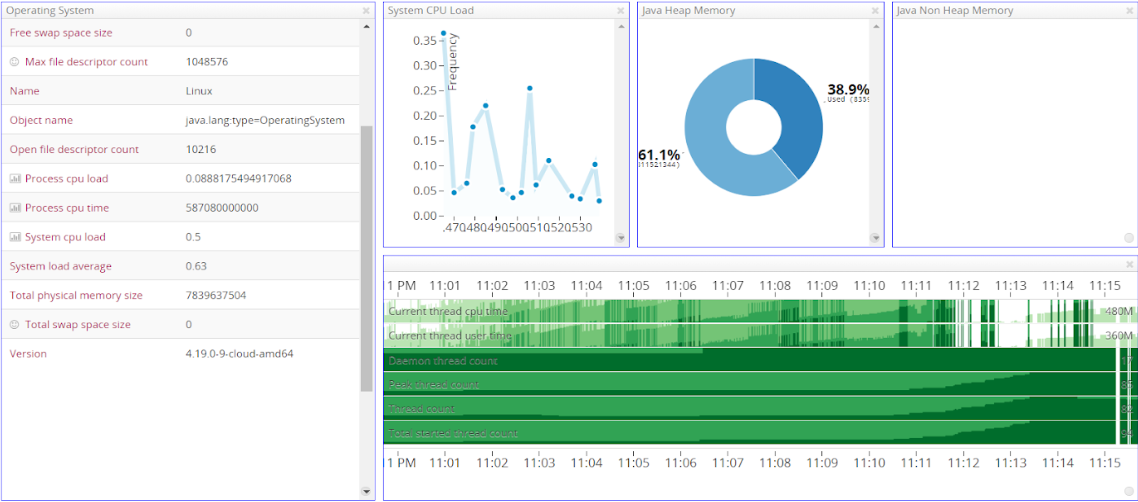
We can see that the two instances have exactly the same number of connections/ open files. This is only possible because we started the instances at the same time, with no prior connections. Scaling the instances in real-time is a challenge in case of WebSockets, which is described in the final paragraph.
On the broker level now, by examining the management console once again, it is clear that the memory usage has increased. The CPU utilization is still at the same level as before:
Performance testing with HTTP Clients
In the following test, we measured the system's performance under load, created by HTTP Locust clients. The flow per user is the following:
The locust HTTP client picks a random username that corresponds to an active WebSocket client (smart device).
The client sends a request with a specific command, by invoking a REST endpoint.
The smart device responds back to the server.
The server responds to the HTTP client, with the data received from the smart device.
The locust receives the response and repeats the sequence after 5 seconds.
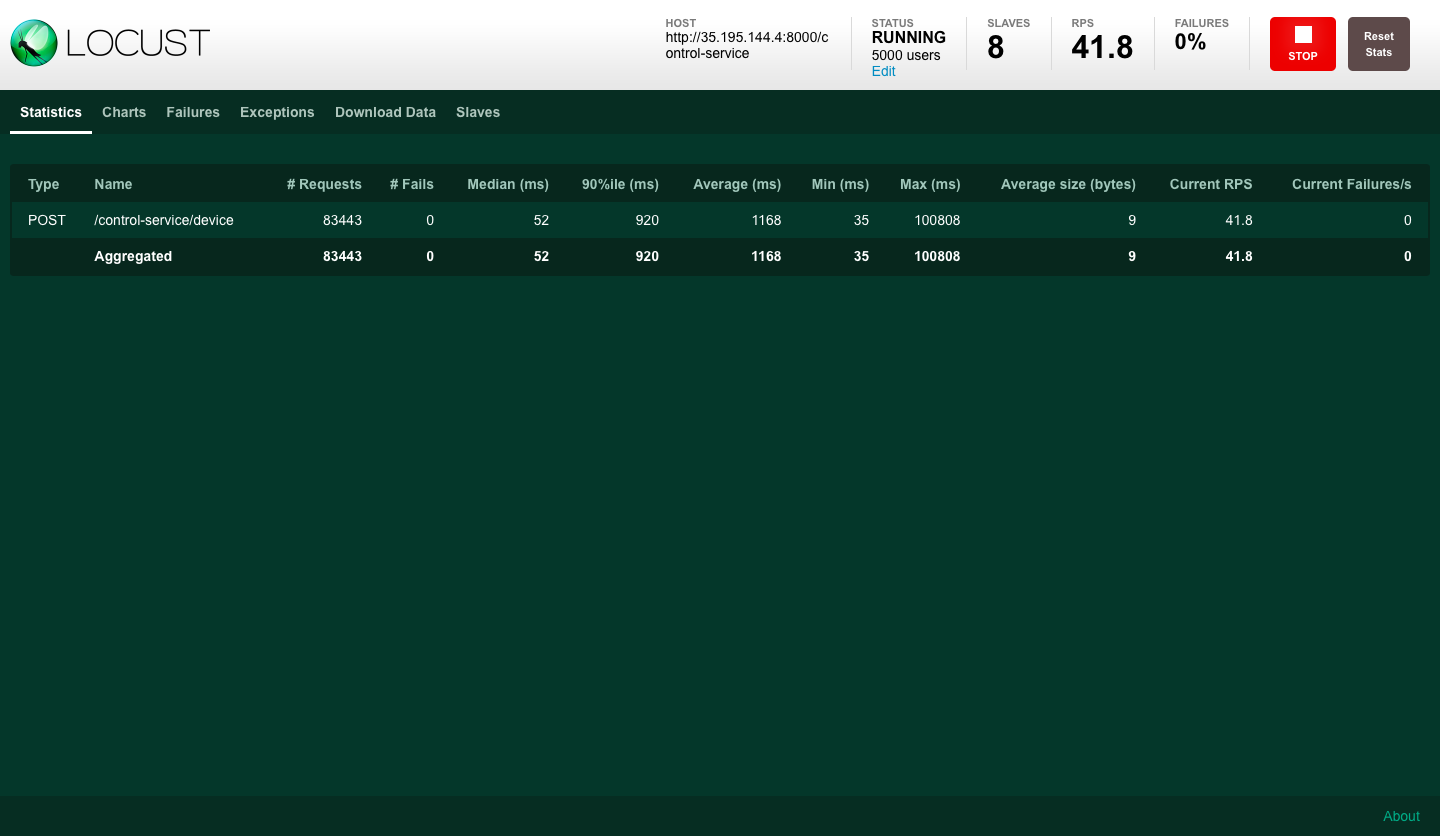
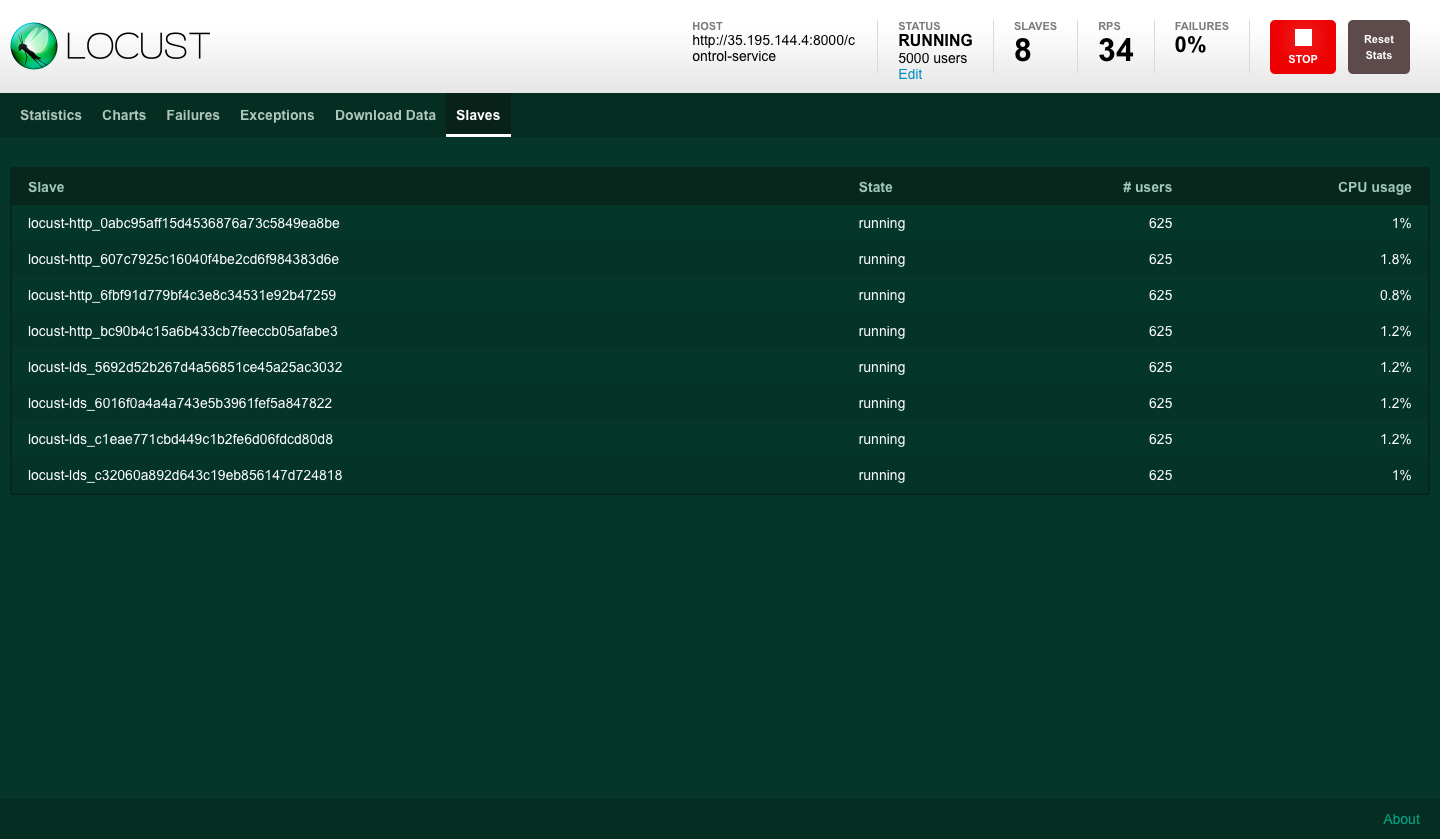
In our example we used 8 slave processes to simulate HTTP traffic. The total number for this example was 5000 divided across the processes.
Locust UI - HTTP client slaves
Horizontal Scaling with WebSockets
Horizontal scaling with WebSockets is a challenging task due to the nature of the connections. As already demonstrated, a basic step towards scalability is utilizing a Message Broker and having multiple instances of WebSocket servers. Extra considerations are needed though for proper load-balancing.
With HTTP, we have a once off request/reply pattern and in general we don’t expect the next request from the client to come back to the same server (unless we have sticky sessions enabled). On the other hand, WebSockets differ from HTTP requests in the sense that they are persistent. The WebSocket client opens up a connection to the server and reuses it.
With HTTP, you can run a virtually unlimited amount of web server instances behind a load balancer. The load balancer passes the request to a healthy web server instance usually following a round-robin policy. With WebSockets a simple round-robin policy may not be the ideal option especially when we need to scale-up. For example in the situation we described above where we have 10k connections evenly distributed between 2 server instances: if we need to scale-up to accommodate more expected (or predicted) users, we can of course spin-up a 3rd and a 4th instance. Ideally, these new servers should take over all the new persistent connection requests. With simple round-robin however the first 2 instances will continue accepting connections thus leading to their saturation faster.
Static configuration
Fact is that in order to be able to handle multiple instances, we need to introduce a load balancer. NGNIX or HAProxy can play this role since both of them support a least_conn balancing mode besides straight round-robin. However, while this solution may accommodate some situations there are two major down-sides: 1) we need to manually configure these proxies when new WebSocket servers are added, 2) we drop the benefits of using an API Gateway in conjunction with Service Discovery.
Adaptive balancing
By using NGNIX only as a reverse proxy and using Spring Cloud Gateway/Eureka we can achieve a more elastic scaling. The downside is that, at the moment, Spring Cloud LoadBalancer supports only round-robin in combination health-check based balancing when Service Discovery is also in place (see Instance Health-Check for LoadBalancer). To overcome this, a custom load balancer could theoretically be applied at the Gateway side following a “least_conn” policy. We could utilize Actuator metrics like tomcat.sessions.active.current or even expose our own custom metric which can be queried by our load balancer to decide where to route the connection to. However this needs caution especially when we are dealing with large deployments and clusters of load balancers (see Problems with JSQ from Netflix’s tech blog). At the moment of writing, there is also the Open issue Add a Power of Two Choices alogrithm implementation for Spring Cloud LoadBalancer which is worthwhile to keep an eye on, when it comes to more sophisticated load balancing options with Spring Cloud.
Final thing to have in mind is: instance failover and connections rebalancing. For example if one WebSocket server becomes unavailable for some reason, given the fact that clients have built-in re-connection handling, they will reconnect to the rest available servers. The system must be able to adapt fast in such cases to prevent overwhelming the responsive servers.
Source code
The complete project (source code, locust scripts and NGNIX configuration) can be found here. As mentioned, load tests were performed on GCP but you can also run everything locally with docker-compose.

