Building Open Source Google Analytics from Scratch
From an engineering standpoint, the technology behind Google Analytics was pretty sophisticated when it was created. Custom, tailored-made algorithms were implemented for event collection, sampling, aggregation, and storing output for reporting purposes. Back then, it required years of engineering time to ship such a piece of software. Big data landscapes have changed drastically since then. In this tutorial, we’re going to rebuild an entire Google Analytics pipeline. We’ll start from data collection and reporting. By using the most recent big data technology available, we’ll see how simple it is to reproduce such software nowadays.
TL;DR
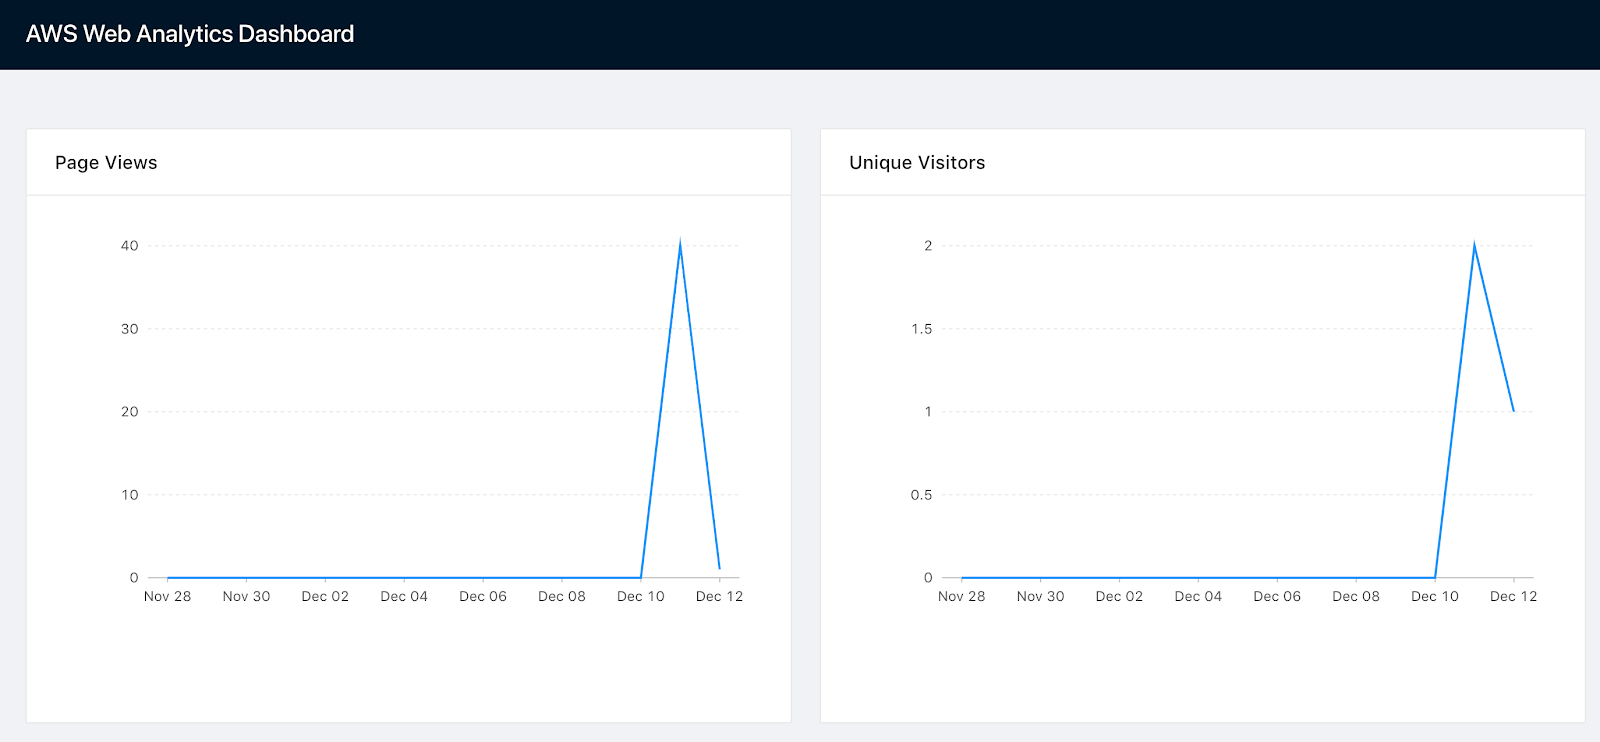
Here’s an analytics dashboard with an embedded tracking code that collects data about its visitors while visualizing it at the same time.
Check out the source code on GitHub. Give it a star if you like it!
How Google Analytics works
If you’re familiar with Google Analytics, you probably already know that every web page tracked by GA contains a GA tracking code. It loads an async script that assigns a tracking cookie to a user if it isn’t set yet. It also sends an XHR for every user interaction, like a page load. These XHR requests are then processed and raw event data is stored and scheduled for aggregation processing. Depending on the total amount of incoming requests, the data will also be sampled.
Even though this is a high-level overview of Google Analytics essentials, it’s enough to reproduce most of the functionality. Let me show you how.
Your Very Own GA Architecture Overview
There are numerous ways of implementing a backend. We’ll take the serverless route because the most important thing about web analytics is scalability. In this case, your event processing pipeline scales in proportion to the load. Just as Google Analytics does.
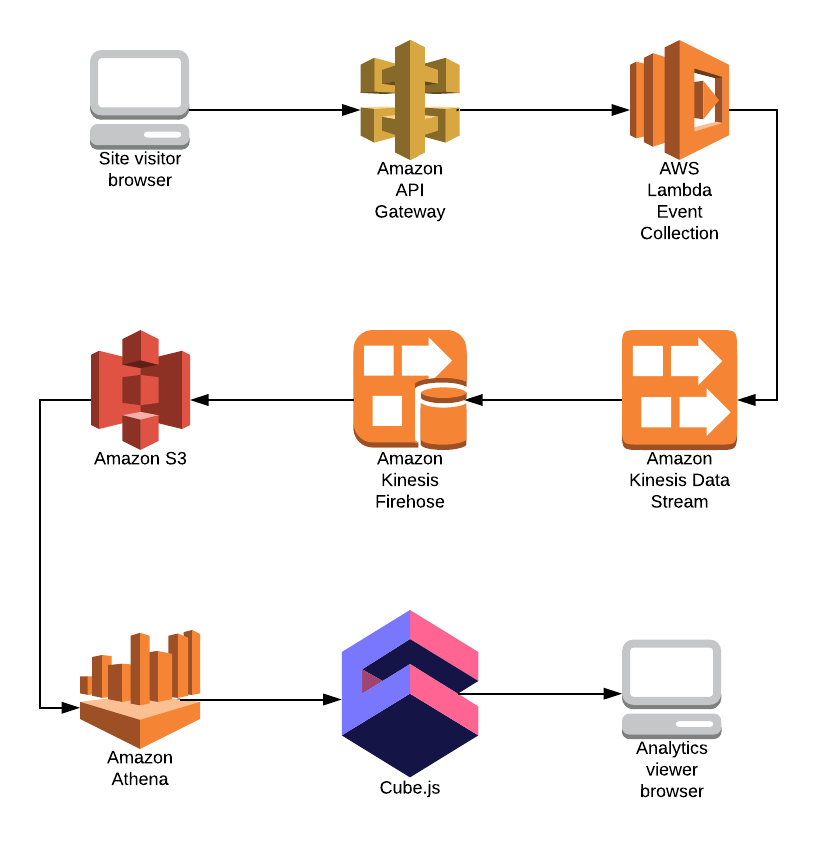
We’ll stick with Amazon Web Services for this tutorial. Google Cloud Platform can also be used as they have pretty similar products. Here’s a sample architecture of the web analytics backend we’re going to build.
For the sake of simplicity, we’re only going to collect page view events. The journey of a page view event begins in the visitor’s browser, where an XHR request to an API Gateway is initiated. The request event is then passed to Lambda where event data is processed and written to a Kinesis Data Stream. Kinesis Firehose uses the Kinesis Data Stream as input and writes processed parquet files to S3. Athena is used to query parquet files directly from S3. Cube.js will generate SQL analytics queries and provide an API for viewing the analytics in a browser.
This seems very complex at first, but component decomposition is key. It allows us to build scalable and reliable systems. Let’s start implementing the data collection.
Building Event Collection Using AWS Lambda
To deploy data collection backend, we’ll use the Serverless Application Framework. It lets you develop serverless applications with minimal code dependencies on cloud providers. Before we start, please ensure Node.js is installed on your machine. Also, if you don’t have an AWS account yet you’d need to signup for free and install and configure AWS CLI.
To install the Serverless Framework CLI let’s run:
# Step 1. Install serverless globally
$ npm install serverless -g
# Step 2. Login to your serverless account
$ serverless login
Now create the event-collection service from a Node.js template:
$ serverless create -t aws-nodejs -n event-collectionThis will scaffold the entire directory structure. Let’s cd to the created directory and add the aws-sdk dependency:
$ yarn add aws-sdkInstall the yarn package manager if you don’t have it:
$ npm i -g yarnWe’ll need to update handler.js with this snippet:
const AWS = require('aws-sdk');
const { promisify } = require('util');

const kinesis = new AWS.Kinesis();

const putRecord = promisify(kinesis.putRecord.bind(kinesis));

const response = (body, status) => {
  return {
    statusCode: status || 200,
    body: body && JSON.stringify(body),
    headers: {
      'Access-Control-Allow-Origin': '*',
      'Access-Control-Allow-Credentials': true,
      'Content-Type': 'application/json'
    }
  }
}

module.exports.collect = async (event, context) => {
  const body = JSON.parse(event.body);
  if (!body.anonymousId || !body.url || !body.eventType) {
    return response({
      error: 'anonymousId, url and eventType required'
    }, 400);
  }

  await putRecord({
    Data: JSON.stringify({
      anonymous_id: body.anonymousId,
      url: body.url,
      event_type: body.eventType,
      referrer: body.referrer,
      timestamp: (new Date()).toISOString(),
      source_ip: event.requestContext.identity.sourceIp,
      user_agent: event.requestContext.identity.userAgent
    }) + '\n',
    PartitionKey: body.anonymousId,
    StreamName: 'event-collection'
  });

  return response();
};
As you can see, the only thing this simple function does is write a record into a Kinesis Data Stream named event-collection. Please note that we’re writing data in new-line delimited JSON format so Athena and Kinesis Firehose can understand it.
Also, we need to modify the serverless.yml in order to deploy everything. Paste this into your serverless.yml file.
service: event-collection

provider:
  name: aws
  runtime: nodejs8.10

  iamRoleStatements:
    - Effect: "Allow"
      Action:
        - "kinesis:PutRecord"
      Resource:
        - "*"

functions:
  collect:
    handler: handler.collect
    events:
      - http:
          path: collect
          method: post
          cors: true
This config will deploy the collect function and assign an API Gateway event trigger to it. It’ll also assign AWS Kinesis Data Stream permissions to the function.
With that, we’re done with writing all the backend code we need for our homemade GA. It’ll be able to handle thousands of incoming events per second. Too much for 2019, isn’t it?
Let’s deploy it to AWS:
$ serverless deploy -vIf everything is okay you’ll get a URL endpoint. Let’s test it with CURL:
curl -d '{}' https://<your_endpoint_url_here>/dev/collectIt should return a 400 status code and an error message that looks like this:
{"error":"anonymousId, url and eventType required"}If this is the case, let’s proceed with the Kinesis setup.
AWS Kinesis setup
First of all, we need to create a Kinesis Data Stream calledevent-collection. First, sign in to your AWS account at console.aws.amazon.com and select Kinesis service from the menu. By default the Serverless Framework deploys resources to the us-east-1region, so we’ll assume the AWS Lambda function was created there and switch regions if necessary before creating the stream.
To create the data stream, we need to set the name to event-collection and set the number of shards. It can be set to 1 for now. The number of shards define your event collection throughput. You can find more information about it here.
Once you’re done with the data stream, create a Kinesis Firehose delivery stream.
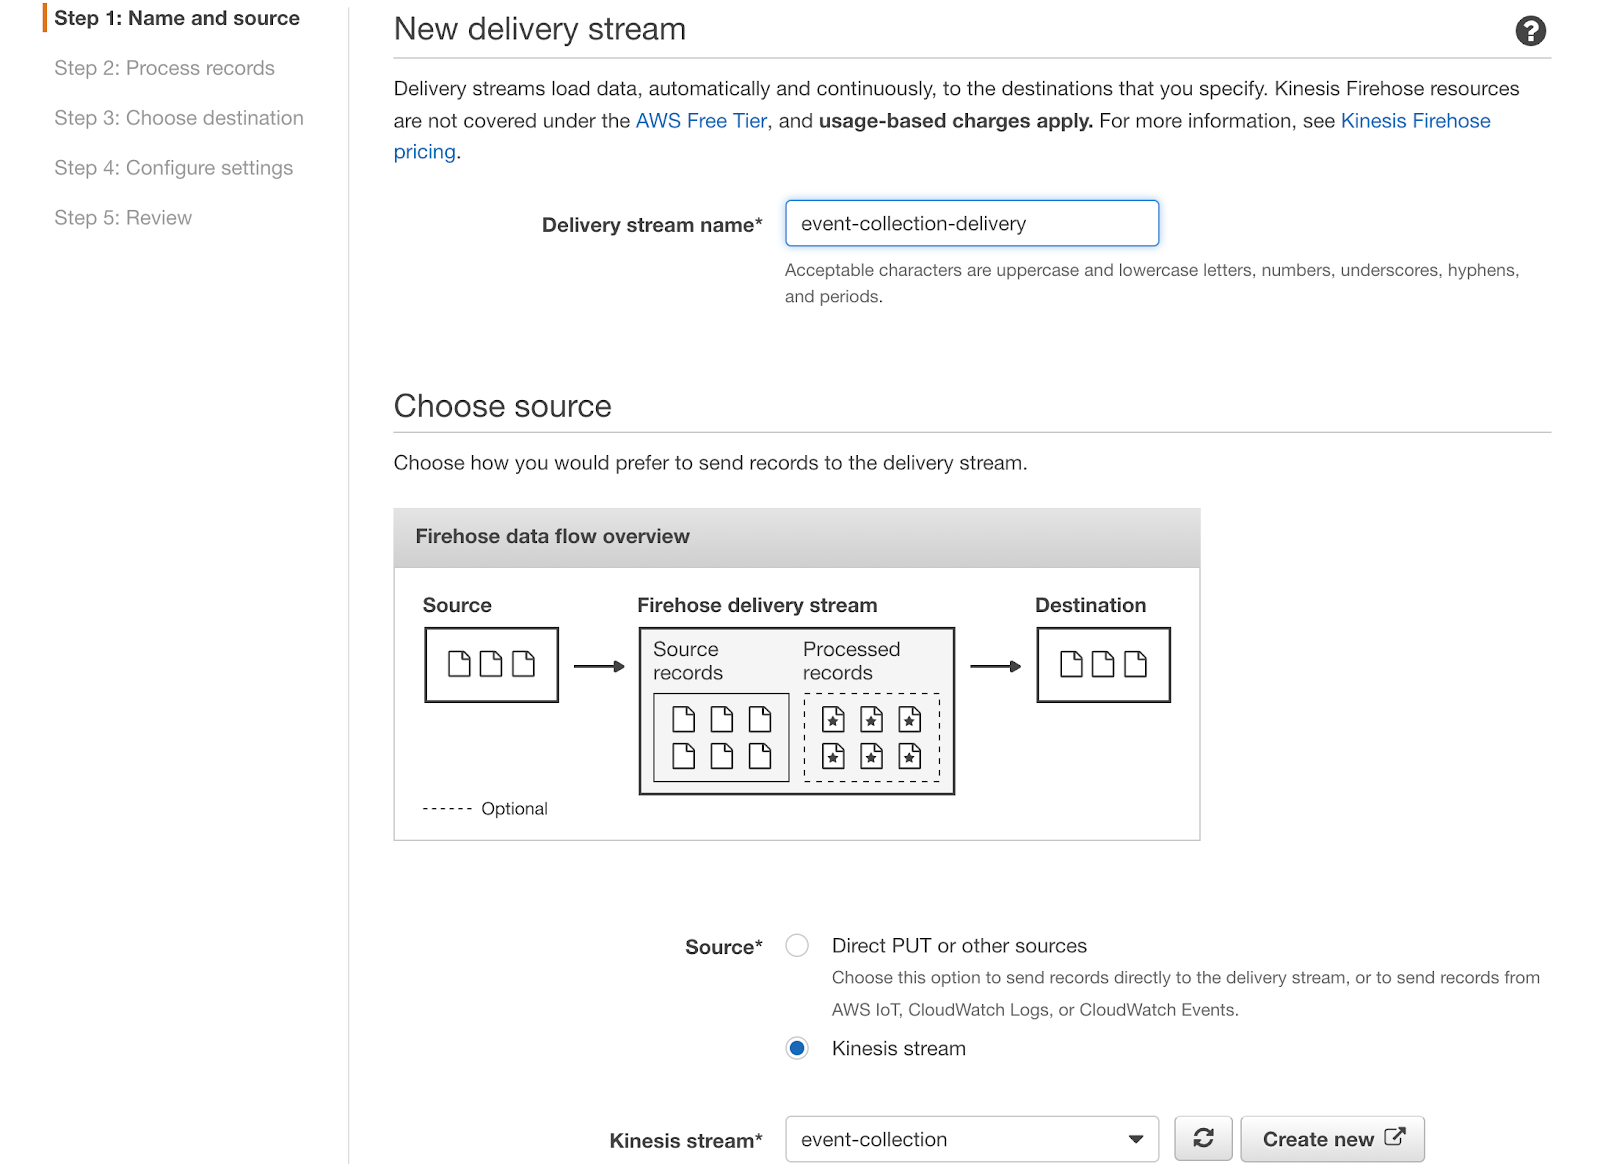
Step 1
You should select event-collection Kinesis stream as a source.
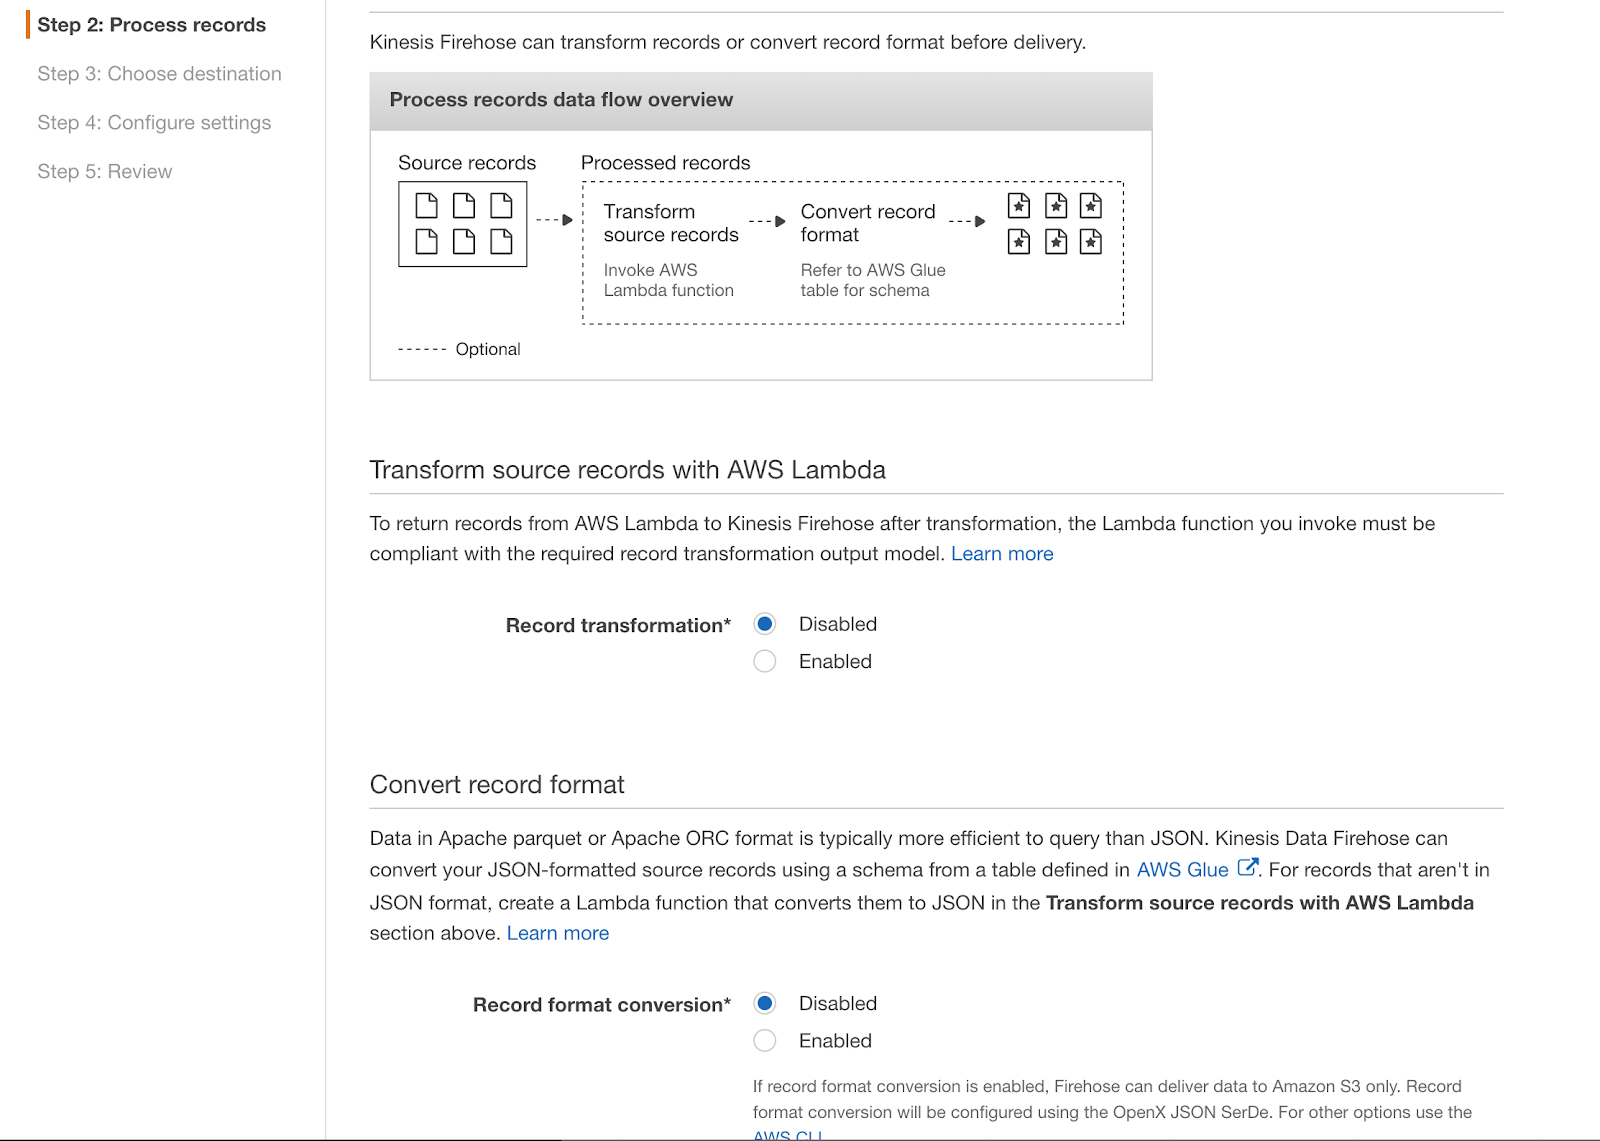
Step 2
For now, to keep this tutorial simple, we don’t need to process any data. In production, you would need to transform it to ORC or Parquet to ensure optimal performance. You can also use this step for event data population like IP to location.
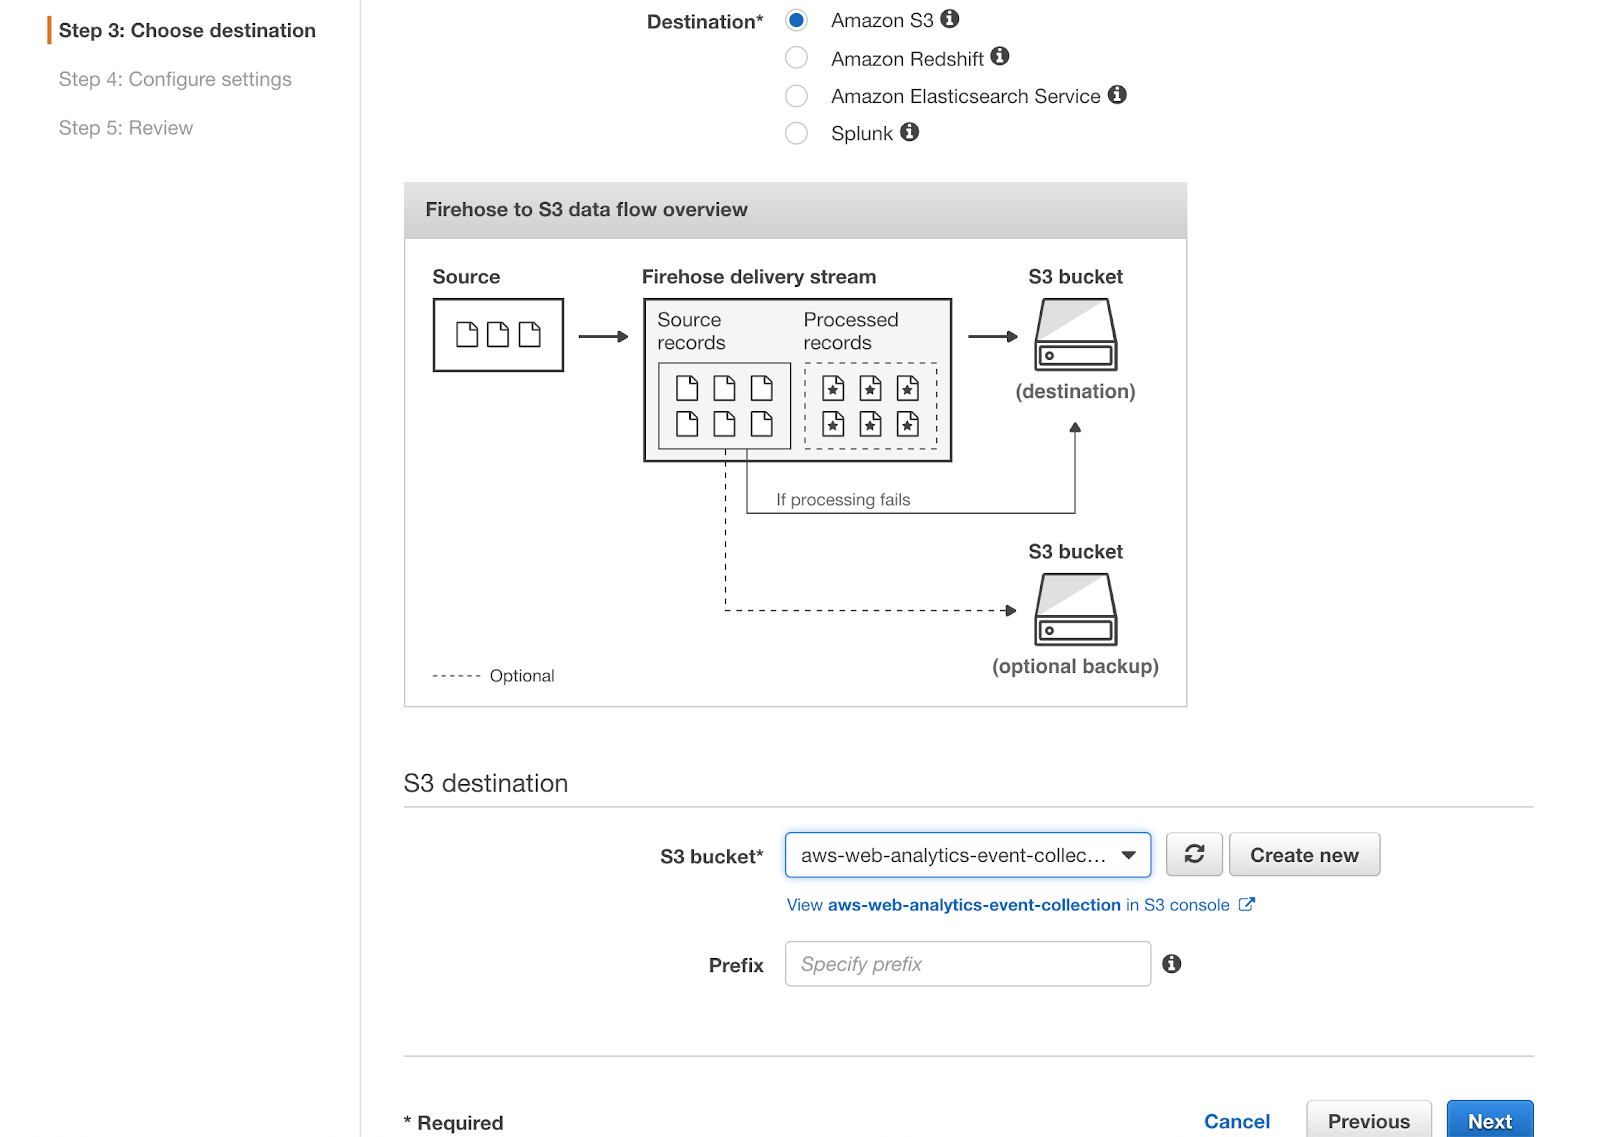
Step 3
We’ll be using S3 as a destination. You need to create a new S3 bucket. Please choose whichever name you like, but add an events suffix as it will contain events.
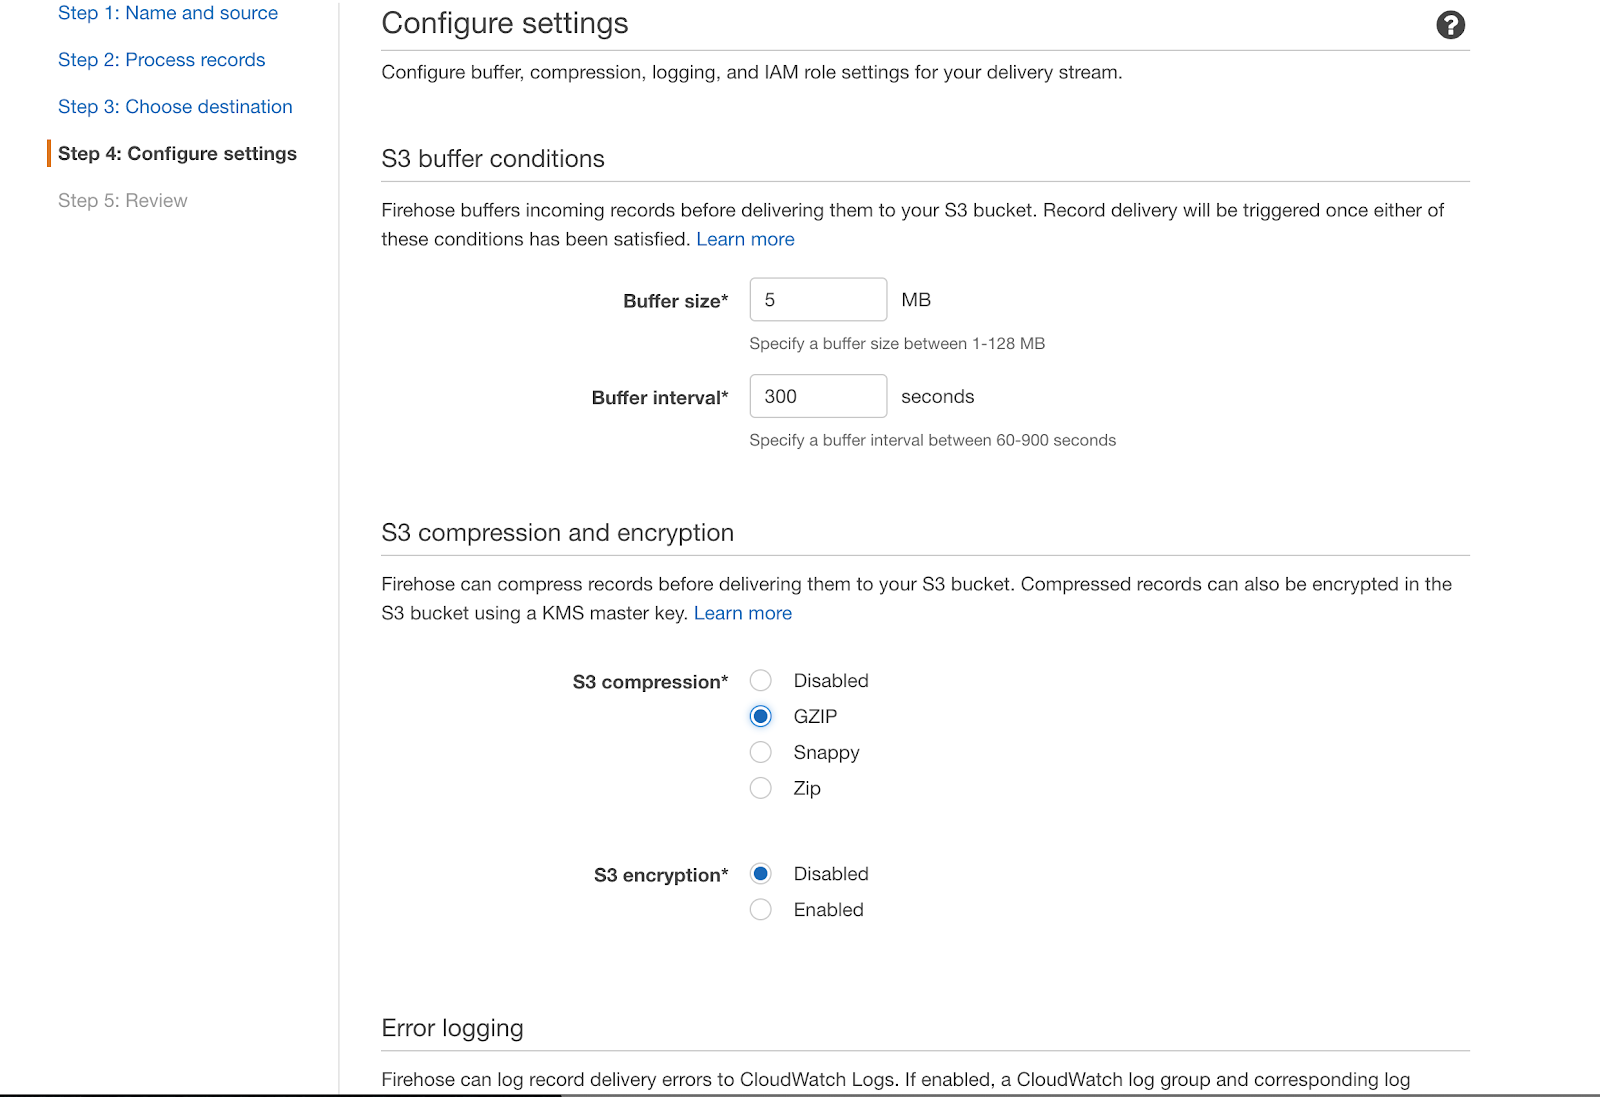
Step 4
Here you can choose Gzip compression to save some billing. You will also be prompted to create an IAM role for this delivery stream. Just follow the instructions.
That’s it. If you’ve done everything right, try to run your AWS Lambda function again with a real payload.
curl -d '{"anonymousId": "123", "url": "-", "eventType": "pageView"}' https://<your_endpoint_url_here>/dev/collectEvents should start flowing to your S3 bucket within five minutes. At this point, the event collection is done. Let’s set up querying for analytics.
Setting Up AWS Athena for Querying Analytics
As data starts flowing to S3, we need to support it with metadata. Athena uses it to understand where to find the data and what structure it has. This is a cumbersome process, but it can easily be done with AWS Glue. Glue is a metadata manager and ETL by AWS. It also has a crawler concept, which acts as a cron job that analyzes S3 data in order to extract metadata from it.
Navigate to Glue from the services menu and select Databases. Add a new database and name it aws_web_analytics. Then go to crawlers and choose "Add crawler."
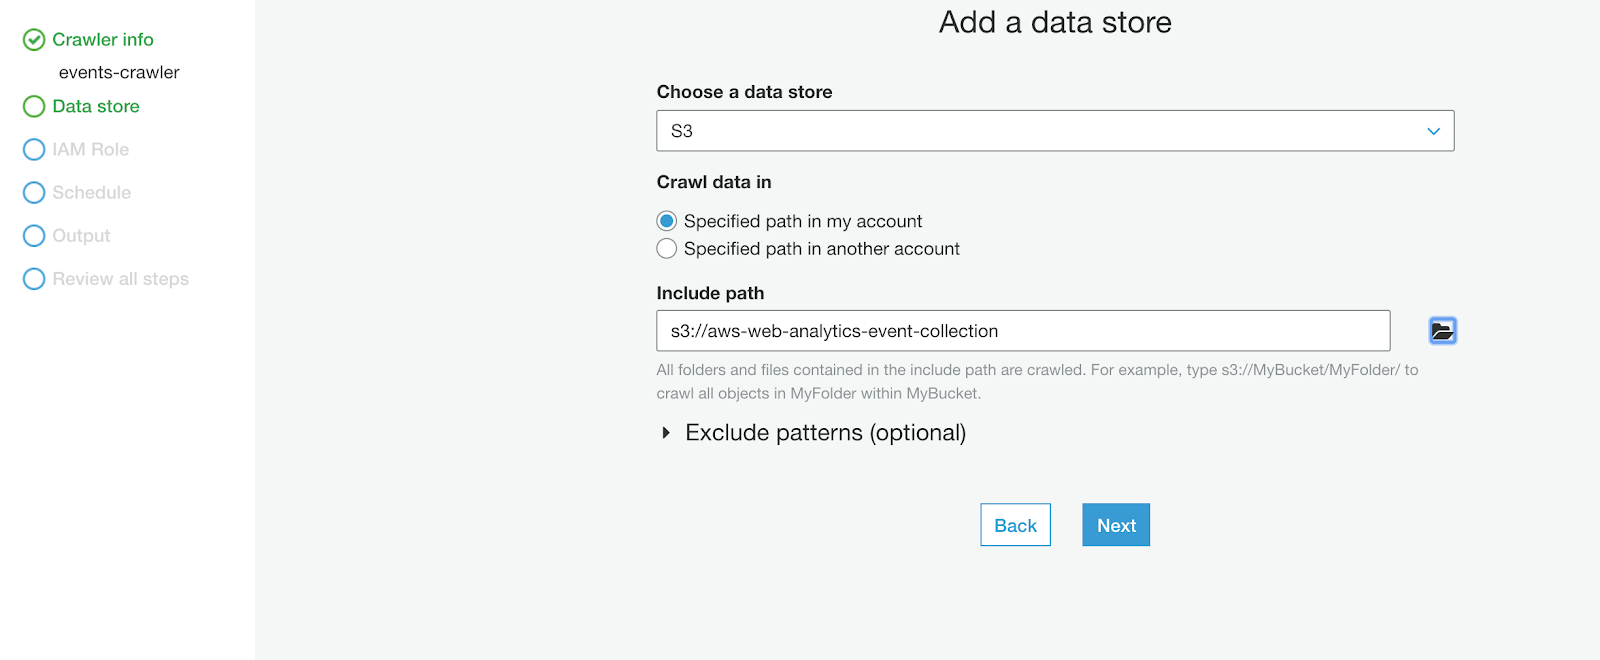
Name it events-crawler and choose the S3 bucket that was just created as the data store:
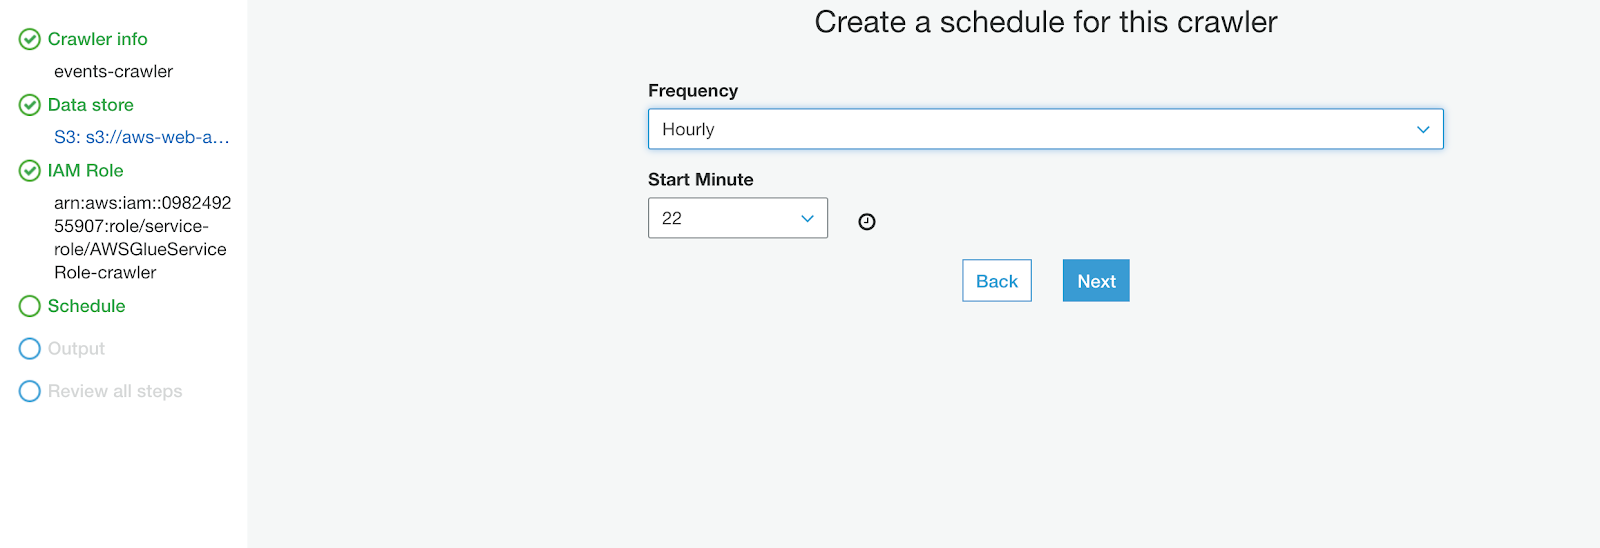
Create an IAM Role according to the instructions and set to run it hourly:
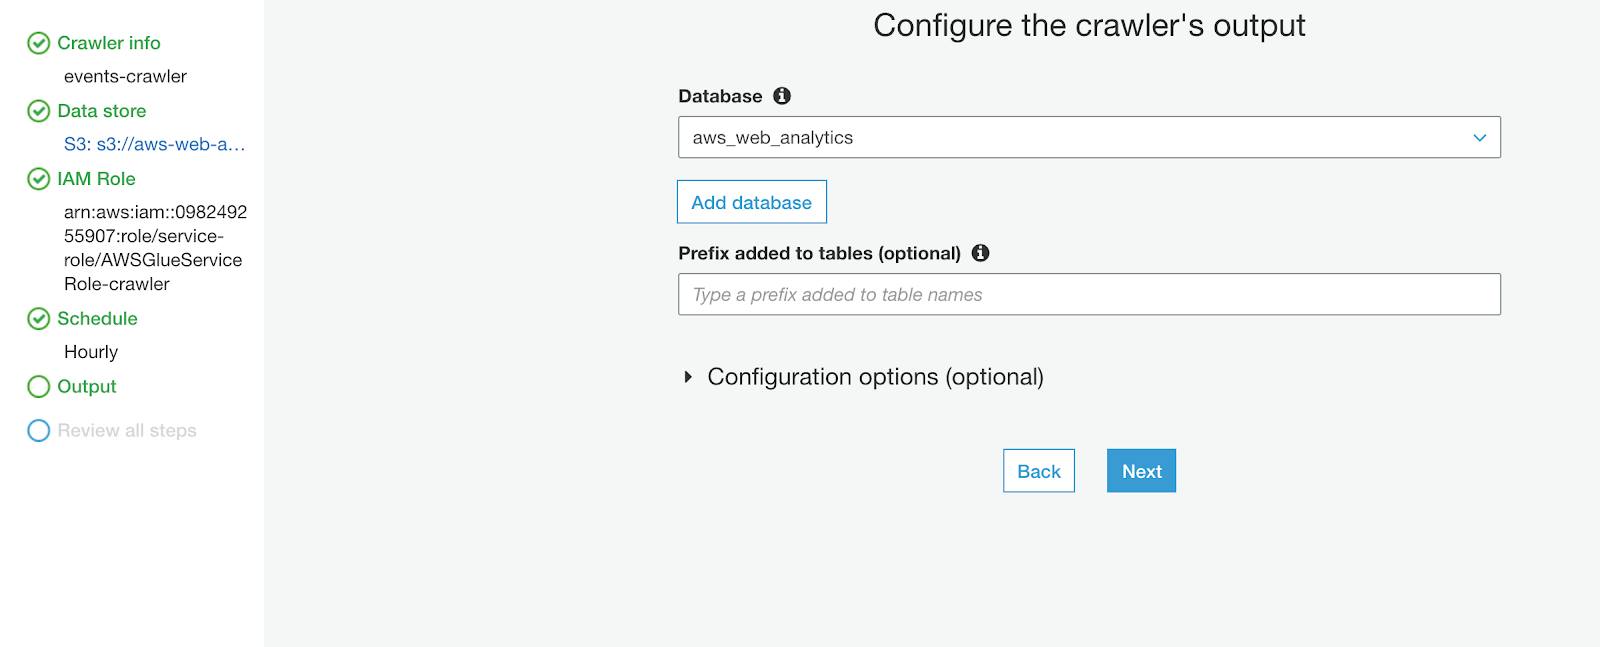
As an output, select the previously created database:
Once it's created, let’s run it manually. If it’s successful, you should see a table in the aws_web_analytics database. Let’s try to query it.
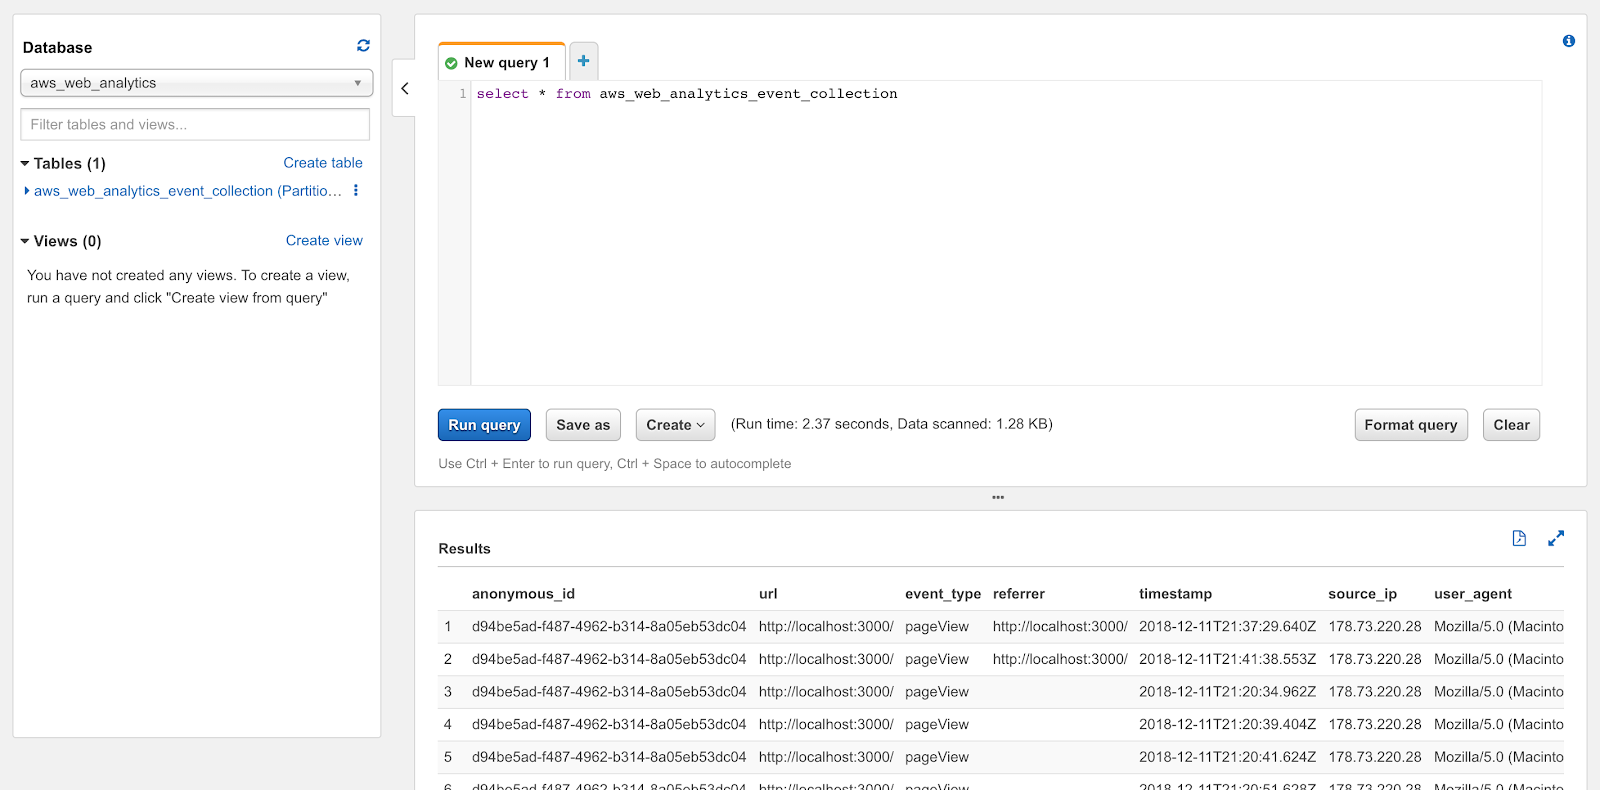
Go to Athena from the services menu. Select the aws_web_analyticsdatabase and write some simple query, such as select * from aws_web_analytics_event_collection. You should get a result like this:
If everything looks fine, we can proceed with building the analytics UI.
Setting Up Cube.js To Provide Analytics for End Users
AWS Athena is a great analytics backend suitable to query petabytes of data, but like any big data backend, it isn’t suitable for directly querying by end users. To provide an acceptable performance vs. cost balance, you should use a caching and pre-aggregation layer on top of it along with an API for querying analytics. This is exactly what Cube.js does!
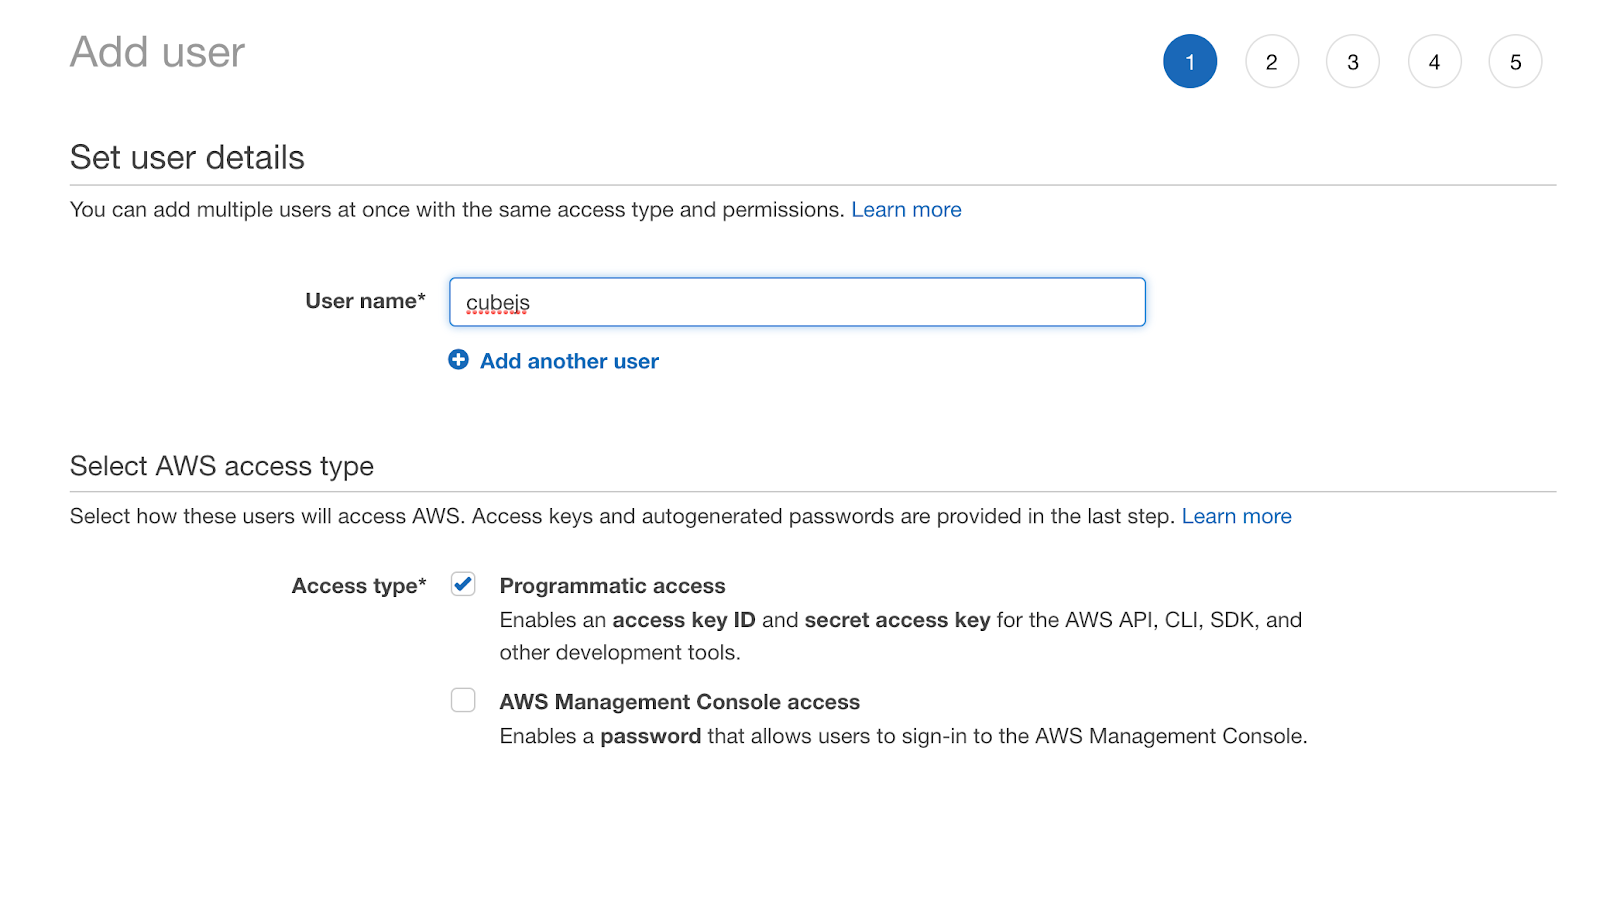
First of all, we need to create an IAM user to access Athena from Cube.js. Select IAM from the AWS services menu. Select Users and click the Add User button. Set the user name to cubejs and enable Programmatic access:
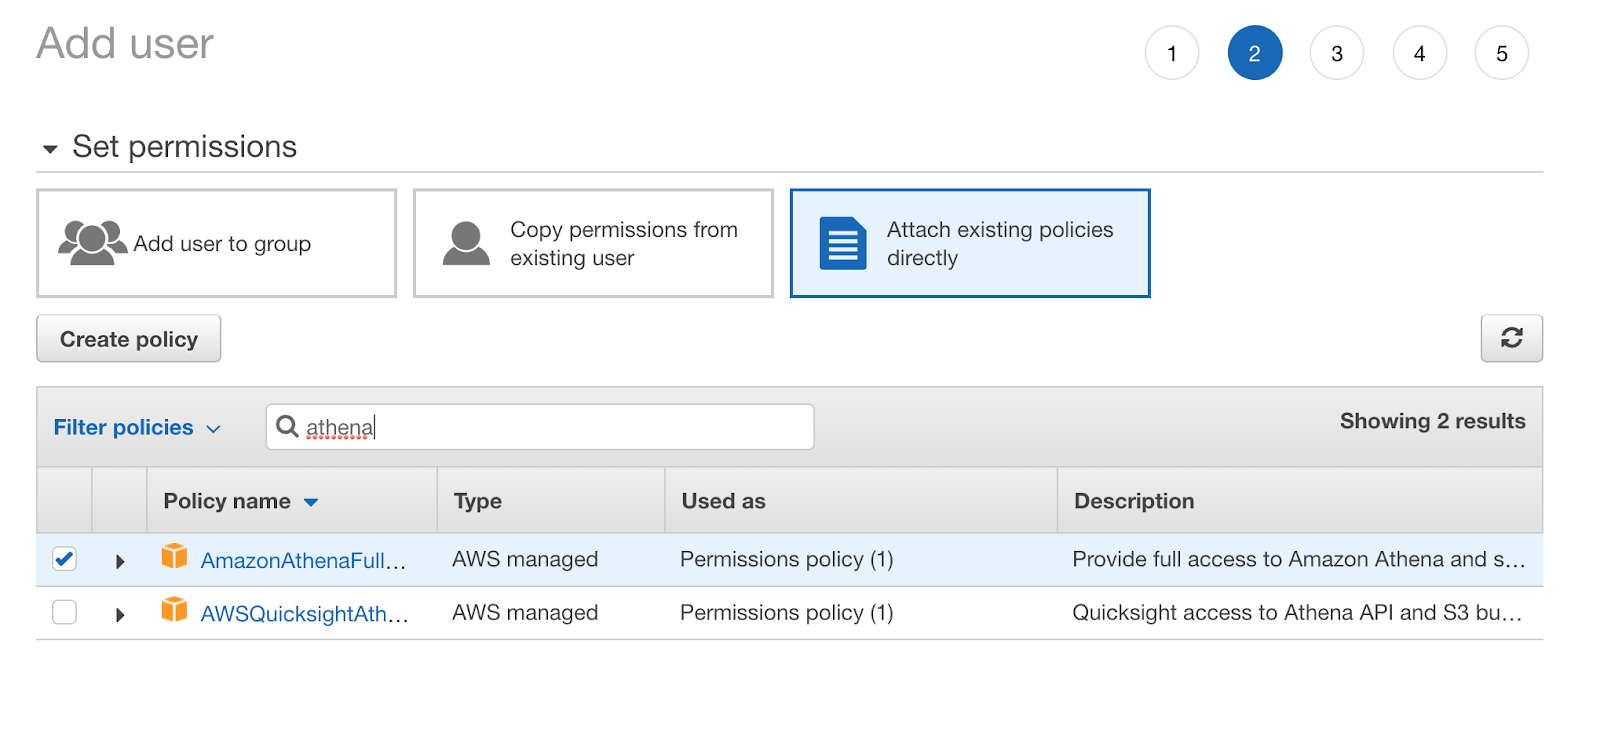
At step 2, select attach existing policies directly then select AmazonAthenaFullAccess and AmazonS3FullAccess:
Move on and create a user. Once it’s created, copy the Access key ID and Secret access key and save it. Please note that you’ll only see the secret once, so don’t forget to store it somewhere.
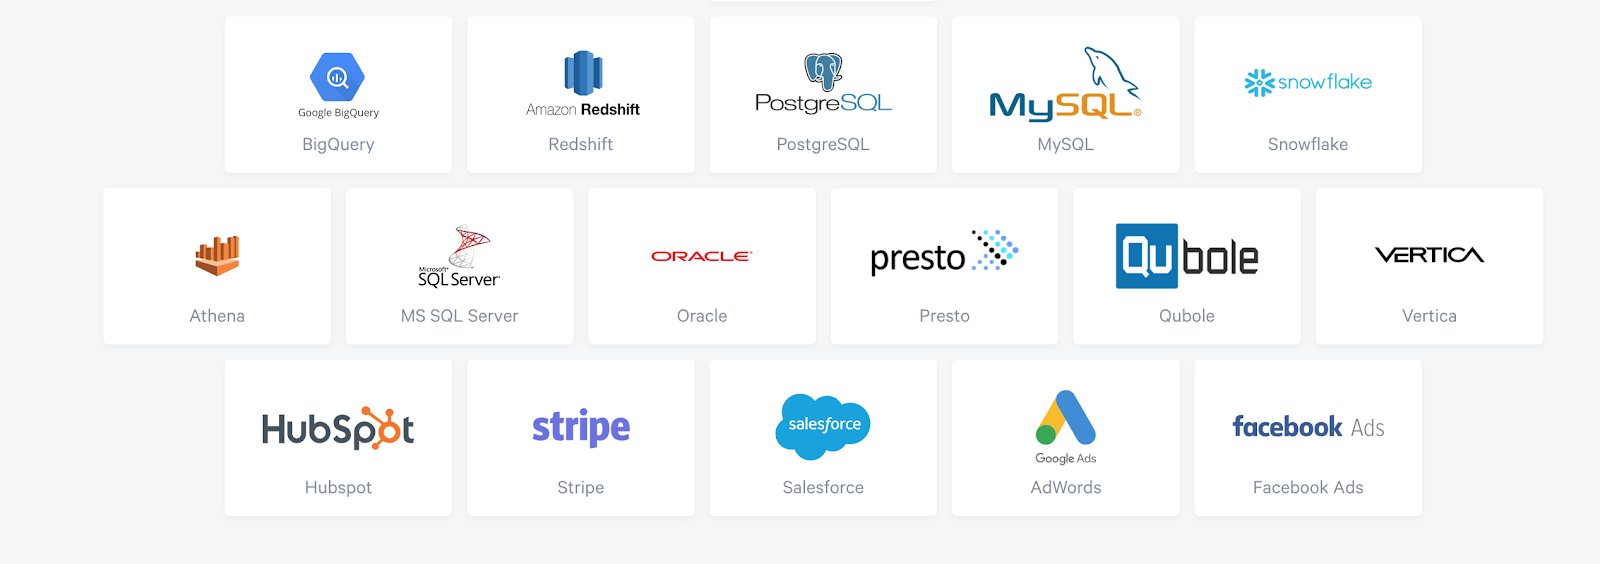
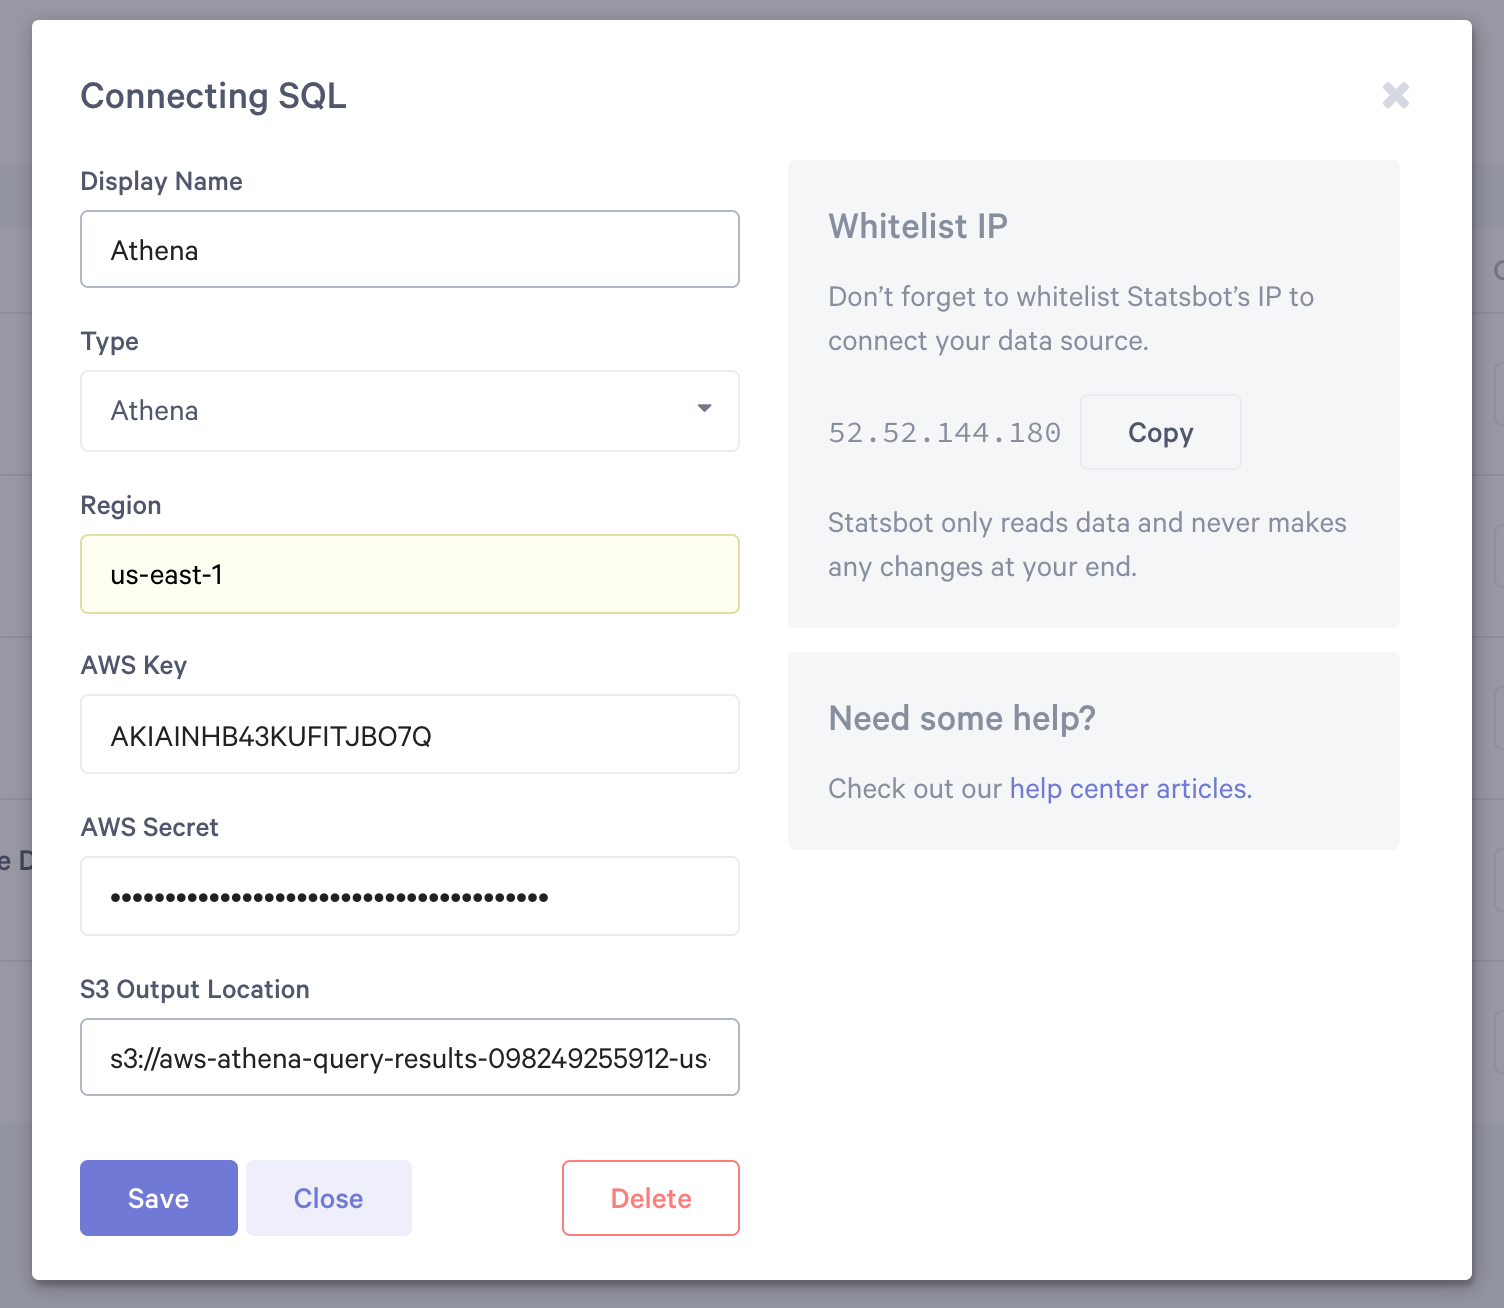
If you don’t have a Cube.js account yet, let’s sign up for free now. After you’ve signed up, connect Athena as a data source:
You should also create a new, or find an existing, S3 bucket to store the Athena result output within the us-east-1 region. The setup should look like this:
If Athena connected successfully, you’ll be forwarded to the Cube.js schema. Let’s create a new PageViews file and paste this in:
cube(`PageViews`, {
 sql: `select * from aws_web_analytics.aws_web_analytics_event_collection`,

 measures: {
   count: {
     type: `count`
   },

   userCount: {
     sql: `anonymous_id`,
     type: `countDistinct`,
   }
 },

 dimensions: {
   url: {
     sql: `url`,
     type: `string`
   },

   anonymousid: {
     sql: `anonymous_id`,
     type: `string`
   },

   eventType: {
     sql: `event_type`,
     type: `string`
   },

   referrer: {
     sql: `referrer`,
     type: `string`
   },

   timestamp: {
     sql: `from_iso8601_timestamp(timestamp)`,
     type: `time`
   }
 }
});
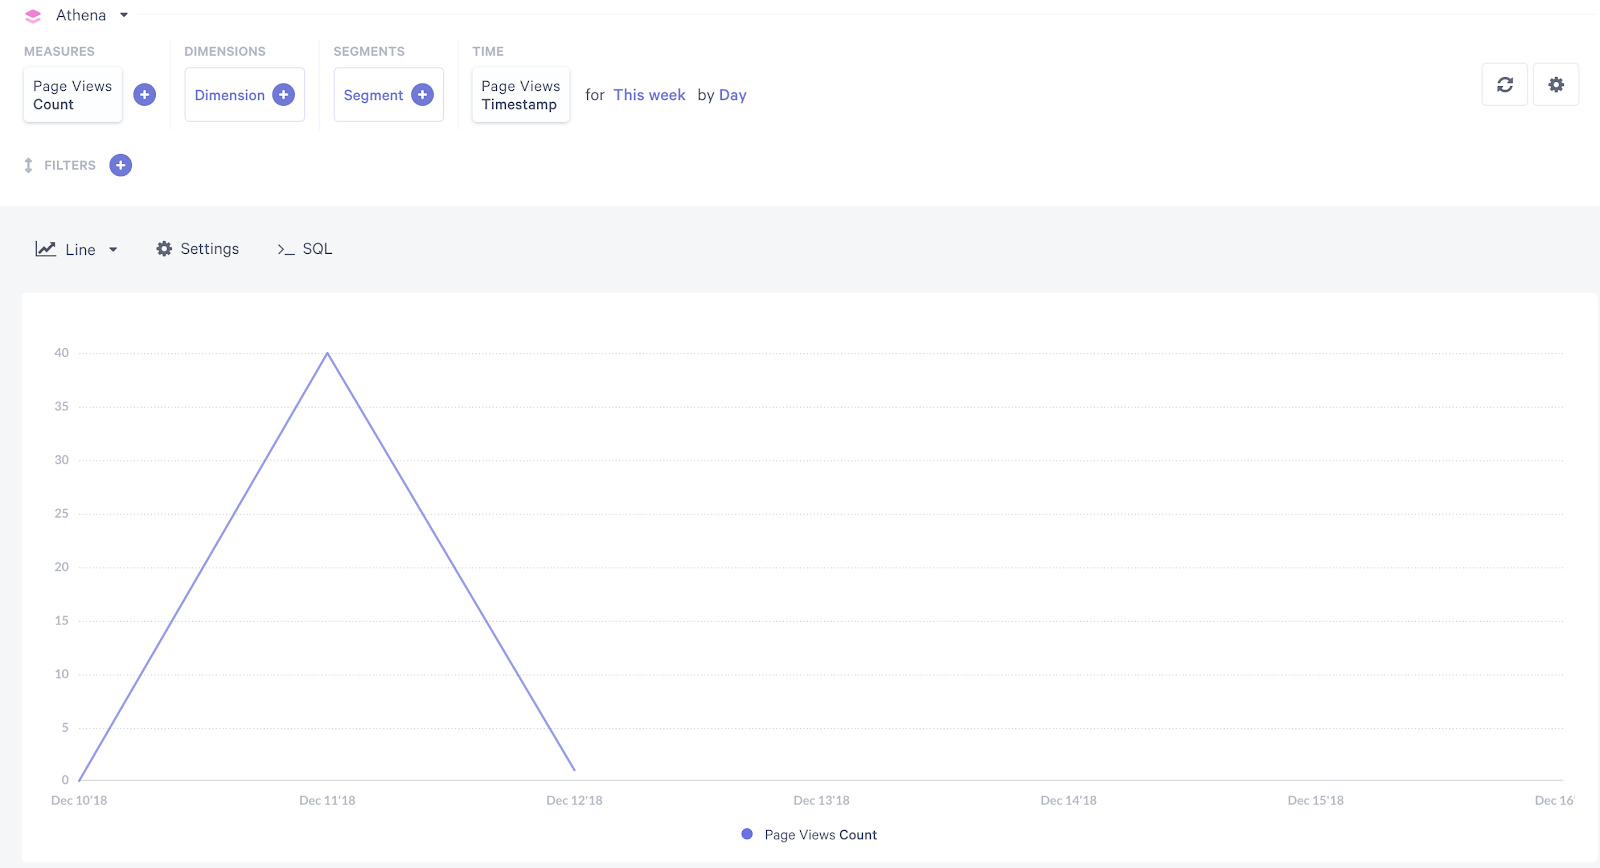
Please replace the event table name with your own. Save the file and go to Explorer. You can learn more about the Cube.js Schema in the documentation here. If everything works the way it should, you will see the Page Views Count for this week
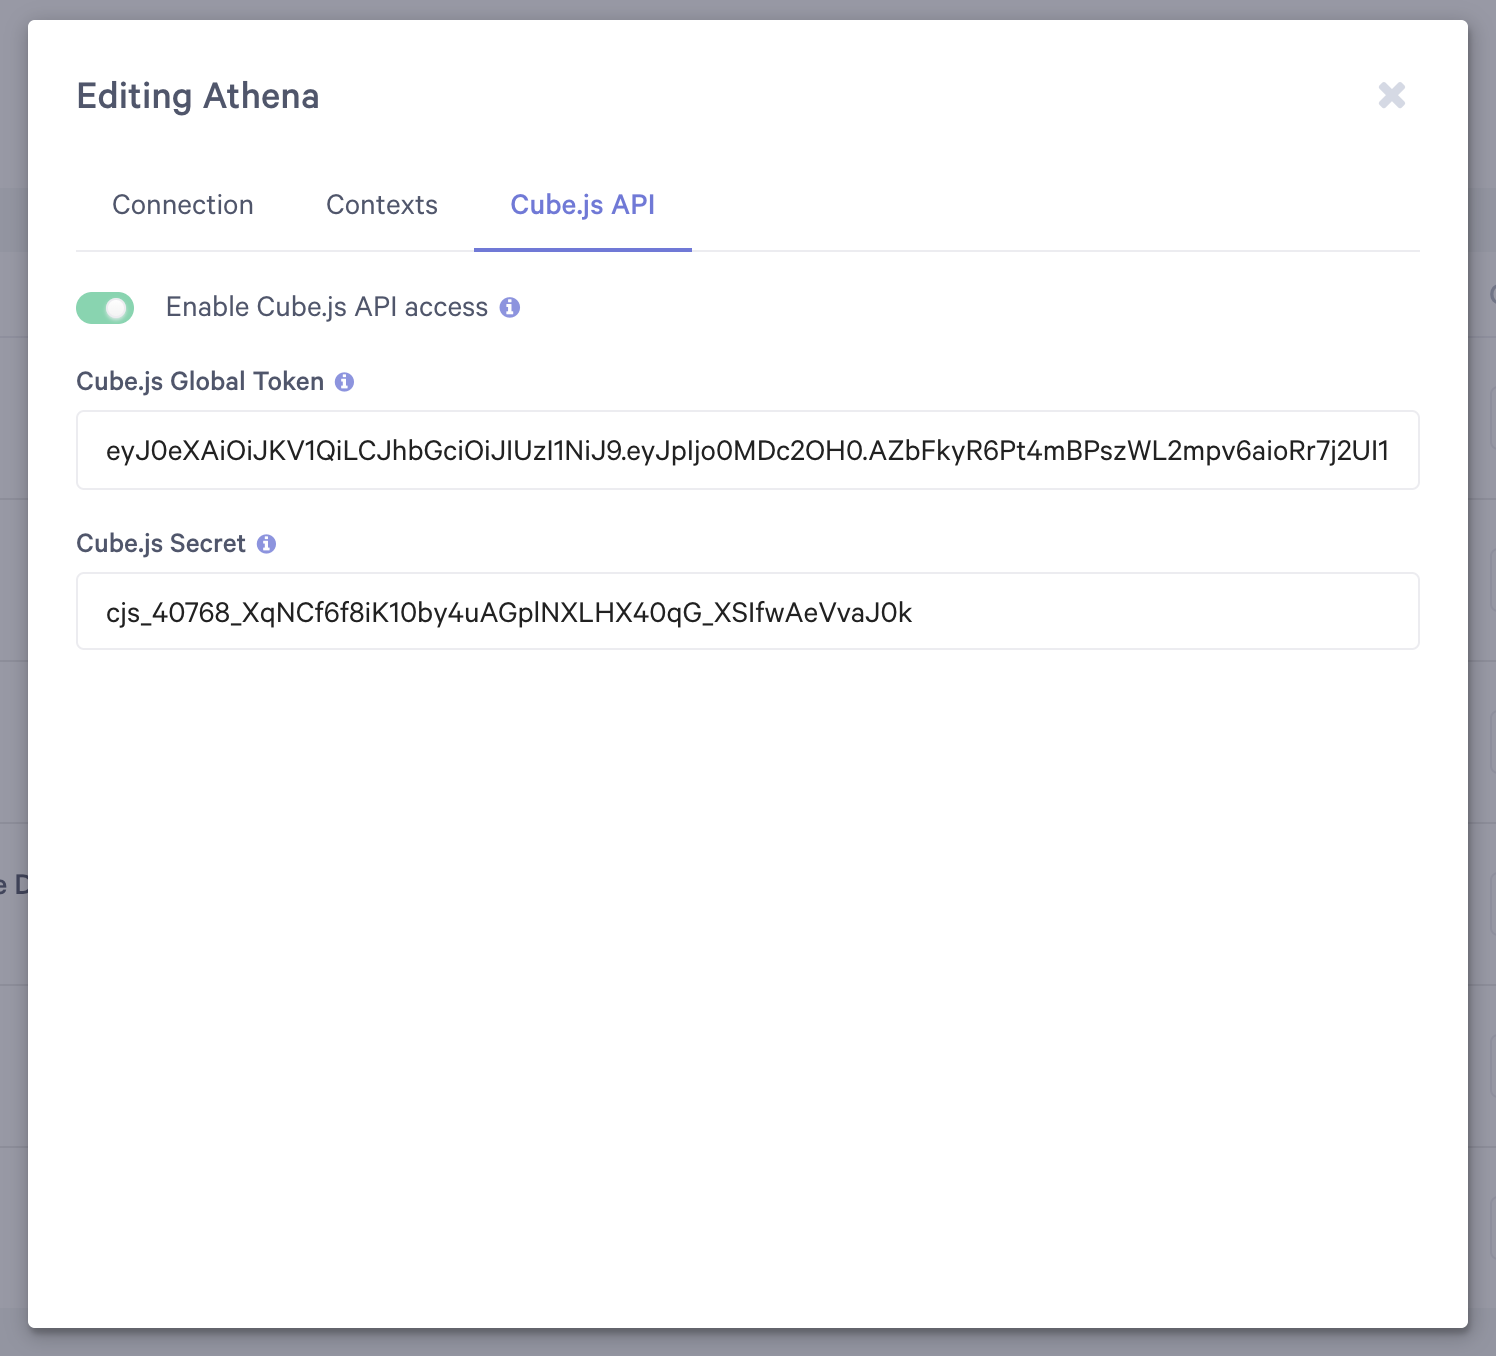
Once it works, we’re ready to enable Cube.js API access. In order to do that, go to Data Sources and Edit Athena data source. In the Cube.js API tab enable Cube.js API access and copy the Global Token:
We’re now ready to create a React application to visualize our analytics.
Building a React Analytics Dashboard
Let’s use create-react-app scaffolding to create a directory structure for our app:
$ yarn create react-app analytics-dashboardThen cd into the created directory and add the required dependencies:
$ yarn add @cubejs-client/core @cubejs-client/react antd bizcharts component-cookie uuid whatwg-fetch momentThe @cubejs-client/core and @cubejs-client/react modules are used to access the Cube.js API in a convenient manner, while antdand bizcharts are used to create layouts and visualize results. The last three, component-cookie, uuid, and whatwg-fetch are used to implement a track page function, which collects event data about users.
Let’s start with the tracking function. Create a track.js file in the analytics-dashboard directory and paste this in:
import { fetch } from 'whatwg-fetch';
import cookie from 'component-cookie';
import uuidv4 from 'uuid/v4';

export const trackPageView = () => {
  if (!cookie('aws_web_uid')) {
    cookie('aws_web_uid', uuidv4());
  }
  fetch(
    'https://<your_endpoint_url>/dev/collect',
    {
      method: 'POST',
      body: JSON.stringify({
        url: window.location.href,
        referrer: document.referrer,
        anonymousId: cookie('aws_web_uid'),
        eventType: 'pageView'
      }),
      headers: {
        'Content-Type': 'application/json'
      }
    }
  )
}
Please replace the URL with your own collect function endpoint. This is all the code we need to track user page views on the client side. This code should be called when a page is loaded.
Let’s create the main App page with two simple charts. In order to do that, replace the App.js contents with this snippet:
import React, { Component } from 'react';
import "antd/dist/antd.css";
import "./index.css";
import { Row, Col, Card, Layout } from "antd";
import cubejs from '@cubejs-client/core';
import { QueryRenderer } from '@cubejs-client/react';
import { Spin } from 'antd';
import { Chart, Axis, Tooltip, Geom, Coord, Legend } from 'bizcharts';
import moment from 'moment';
import { trackPageView } from './track';

const dateRange = [
  moment().subtract(14,'d').format('YYYY-MM-DD'),
  moment().format('YYYY-MM-DD'),
];

const { Header, Footer, Sider, Content } = Layout;

const renderChart = (resultSet) => (
  <Chart scale={{ category: { tickCount: 8 } }} height={400} data={resultSet.chartPivot()} forceFit>
    <Axis name="category" label={{ formatter: val => moment(val).format("MMM DD") }} />
    {resultSet.seriesNames().map(s => (<Axis name={s.key} />))}
    <Tooltip crosshairs={{type : 'y'}} />
    {resultSet.seriesNames().map(s => (<Geom type="line" position={`category*${s.key}`} size={2} />))}
  </Chart>
);

const API_KEY = 'eyJ0eXAiOiJKV1QiLCJhbGciOiJIUzI1NiJ9.eyJpIjo0MDY3OH0.Vd-Qu4dZ95rVy9pKkyzy6Uxc5D-VOdTidCWYUVhKpYU';

class App extends Component {
  componentDidMount() {
    trackPageView();
  }

  render() {
    return (
      <Layout>
          <Header>
            <h2 style={{ color: '#fff' }}>AWS Web Analytics Dashboard</h2>
          </Header>
          <Content style={{ padding: '25px', margin: '25px' }}>
            <Row type="flex" justify="space-around" align="middle" gutter={24}>
              <Col lg={12} md={24}>
                <Card title="Page Views" style={{ marginBottom: '24px' }}>
                  <QueryRenderer
                    query={{
                      "measures": [
                        "PageViews.count"
                      ],
                      "timeDimensions": [
                        {
                          "dimension": "PageViews.timestamp",
                          "dateRange": dateRange,
                          "granularity": "day"
                        }
                      ]
                    }}
                    cubejsApi={cubejs(API_KEY)}
                    render={({ resultSet }) => (
                      resultSet && renderChart(resultSet) || (<Spin />)
                    )}
                  />
                </Card>
              </Col>
              <Col lg={12} md={24}>
                <Card title="Unique Visitors" style={{ marginBottom: '24px' }}>
                  <QueryRenderer
                    query={{
                      "measures": [
                        "PageViews.userCount"
                      ],
                      "timeDimensions": [
                        {
                          "dimension": "PageViews.timestamp",
                          "dateRange": dateRange,
                          "granularity": "day"
                        }
                      ]
                    }}
                    cubejsApi={cubejs(API_KEY)}
                    render={({ resultSet }) => (
                      resultSet && renderChart(resultSet) || (<Spin />)
                    )}
                  />
                </Card>
              </Col>
            </Row>
          </Content>
        </Layout>
    );
  }
}

export default App;
Make sure to replace the API_KEY constant with your own Cube.js Global Token. You should be able to see the dashboard with two charts:
Once again, here’s the deployed version of the dashboard, if you want to check it out.
To deploy your own, create a public S3 bucket with static site serving enabled, build the app, and sync it to the bucket:
$ yarn build
$ aws s3 sync build/ s3://<your_public_s3_bucket_name>
You also can use a service like Netlify to host your website. They make it incredibly simple to deploy and host a website.
Conclusion
This tutorial has shown you how to build a proof of concept compared to the Google Analytics feature set. The architecture is scalable enough to handle thousands of events per second, and can analyze trillions of data points without breaking a sweat. Cube.js is suitable for implementing all metrics you expect to see in GA, such as bounce rate, session time spent, etc. You can read more about it here. Large scale analytics can’t be built without the pre-aggregation of data. GA does this a lot and Cube.js has a built-in solution for it.

