3.6 Million Queries per Second on a Single VM Using MySQL With Dynimize
It's not every day that you get to break a record. So when I discovered that you can now rent by the hour massive instances within Google Compute Cloud that support 224 virtual cores based on AMD EPYC 2 Rome processors, I had to jump at the opportunity to see what kind low hanging fruit might be out there. Low and behold I found it! The record for MySQL on a single server stands at 2.1M QPS without using Unix sockets, and 2.25M QPS with Unix sockets. Seeing that was published 3 years ago on Broadwell based CPUs, I suspected this record was ripe for the taking on one of these instances, especially if we put Dynimize to work. The following post describes the journey to 3.6 million queries per second with MySQL 8.0 using one of these servers.
The MySQL Server Team has done a fantastic job at getting newer versions of MySQL to scale to more and more cores, and the MySQL 8.0 release was no exception. At 96 physical cores, they've shown the world how MySQL 8.0 easily scales to take advantage of the parallelism you can now get a hold of on the most powerful x86-64 based servers. However, I've been dying to know what kind of record QPS is possible if we put CPU performance virtualization to use through Dynimize, which can significantly increase the instructions per cycle (IPC) or programs like MySQL.
The remainder of this post will walk us through all the steps I took to reach 3.6M queries per second on this single VM instance.
Hardware
| Instance Type | Google Compute Platform n2d-highcpu-224 |
|---|---|
| Cores | 224 virtual |
| CPU Model | AMD EPYC 7B12 / 2.25GHz |
| RAM | 224 GB |
| Storage | GCP Standard SSD |
The wonderful thing here is that at a mere $5/hour, one can easily take the scripts used for these runs and repeat these tests at little cost. I think it's always great if you can do your benchmarking on an easily accessible, publicly available server to rent so that others can recreate your experiments. This creates an extra level of validation and transparency, and may also allow others the opportunity to improve upon your results.
Software
| MySQL | 8.0.21 |
|---|---|
| Dynimize | 1.1.3.16 |
| Distro | Ubuntu 20.04 LTS |
| Kernel | 5.4.0-1022-GCP x86_64 |
| Workload | Sysbench 1.0.20 OLTP Point Select, 8 x 10M rows |
This is the stock Ubuntu 20 distro that Google Compute Cloud provides, along with the MySQL version available with the default MySQL Server repository that comes with it. I also installed jemalloc and set LD_PRELOAD to use it in both mysqld and sysbench.
How it Was Run
The following my.cnf was used:
max_connections=2000
default_password_lifetime=0
ssl=0
performance_schema=OFF
innodb_open_files=4000
innodb_buffer_pool_size=32000M
One noteworthy thing I found with my.cnf is that once I size the buffer pool accordingly, disable the performance schema and SSL, the default settings provide for excellent performance here without a need to excessively tune other parameters. Disabling the binary log appears to prevent large intermittent dips in throughput here; however, I've left it enabled to not include any settings that would disqualify this my.cnf for production.
To incorporate Dynimize I perform a warmup before beginning measurements (for both with and without Dynimize) to allow mysqld to reach the dynimized state. This warmup is done once using 256 Sysbench client threads, and I then proceed to run and record Sysbench results from 1 to 1024 connections without restarting the mysqld server process so that mysqld remains dynimized. Below is the sysbench command used for these tests.
sysbench /usr/share/sysbench/oltp_point_select.lua --db-driver=mysql \
--table-size=10000000 --tables=8 --threads=$1 --time=300 \
--rate=0 --report-interval=1 --rand-type=uniform --rand-seed=1 \
--mysql-user=$user --mysql-password=$pass --mysql-host=$host \
--mysql-port=$port --events=0 run
The actual scripts used can be found in this GitHub repository along with the raw results. So let's see what happened.
Baseline Performance
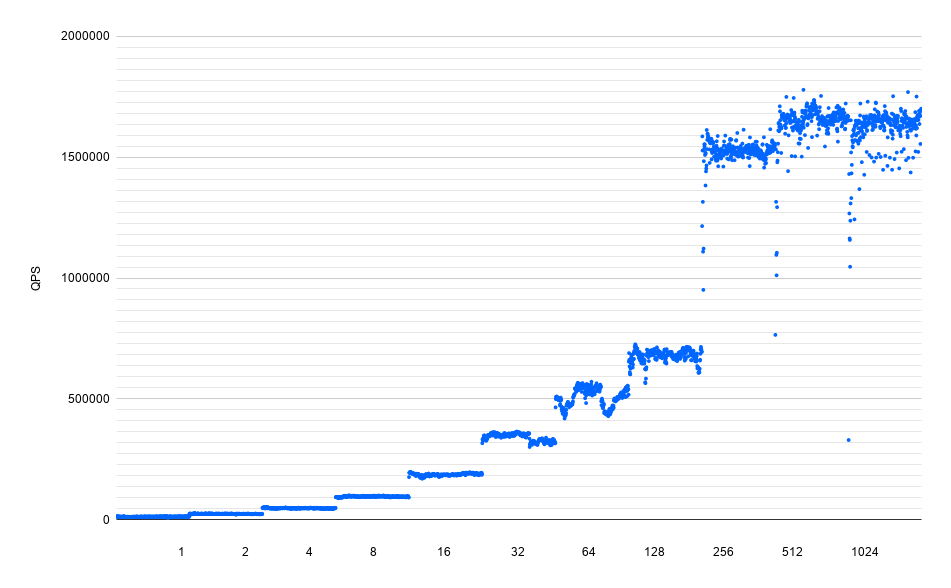
The above results without Dynimize show a peak throughput of 1.6 M QPS at 512 client connections using TCP/IP. That's a very impressive number to start with for a single VM instance although falls short of the 2.1M QPS record we are trying to break. Note that here we are plotting each throughput sample at one-second intervals.
Enter Dynimize
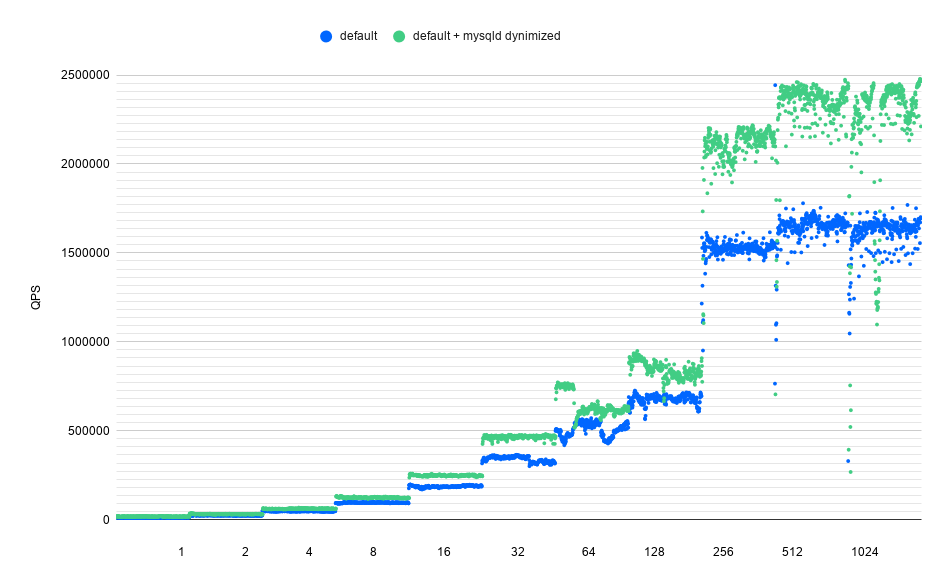
The below graph shows the results after Dynimize CPU performance virtualization is applied. From this, we can see a 44% increase in performance by simply installing Dynimize and running dyni -start during the warmup period. Here's a quickstart tutorial in case you're curious as to how to do this. 44% is a non-trivial improvement folk. That's quite the understatement. And with a peak throughput of 2.3M QPS using TCP/IP, we've broken the previous 2.1M QPS record that was set using a Broadwell based bare metal server.
Single-Threaded Improvements
There's more to these Dynimize gains. New releases of MySQL have achieved better results on this workload by being able to better scale and take full advantage of the more cores on offer with the latest CPUs. Of course, that is a very challenging task and nothing to scoff at. However in real life that means newer versions of MySQL won't necessarily increase performance on many workloads when run on hardware with a more modest number of cores.
In fact, at times they can even reduce performance. And realistically who's using servers with these many cores today? While some may, the reality is that for most, these scalability improvements on newer versions aren't necessarily helpful without upgrading your current hardware to something with a very high number of CPU cores; however, notice something about the Dynimize results… increased performance at every concurrency level.
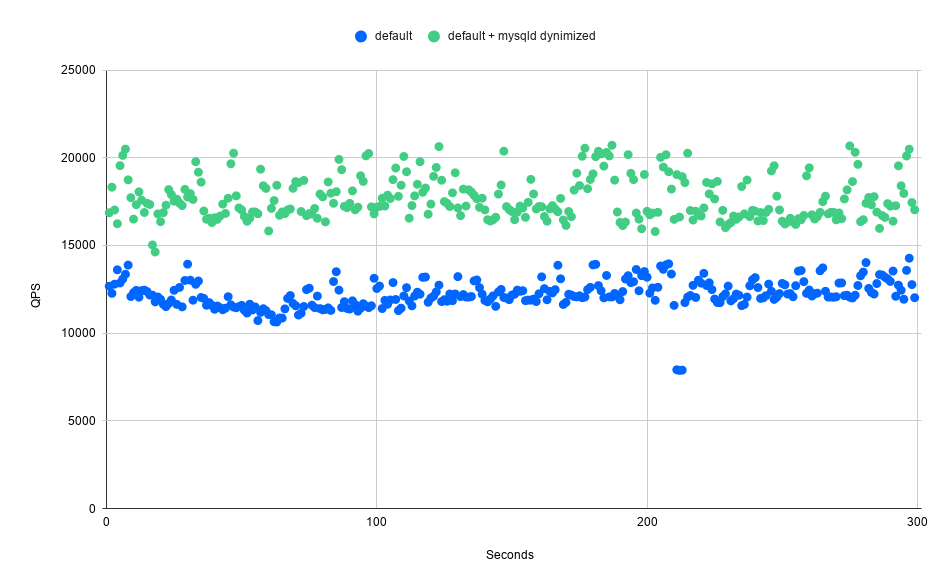
That's because Dynimize achieves the holy grail of performance improvements - improving single threaded CPU performance. That type of improvement simply scales when you add more cores and more threads. That means workloads on smaller servers can also benefit. This single threaded result is somewhat difficult to see with the above graph, so let's zoom in to just the runs with a single connection, as seen below.
Reduced Response Time
All this sounds amazing, but what matters to our end users? A high throughput number feels great, gives me chest-thumping bragging rights, and adds a boost to help me reach a record QPS number for my blog post's eye-catching benchmarketing title. However for most situations what matters is what the end-user of our applications experience, which for our purposes all comes down to response time. You'll notice in the below graph that the gains Dynimize achieves are a result of reduced response time at every concurrency level. That's a critical improvement that many of us can apply in many real-world situations to the benefit of our end users.
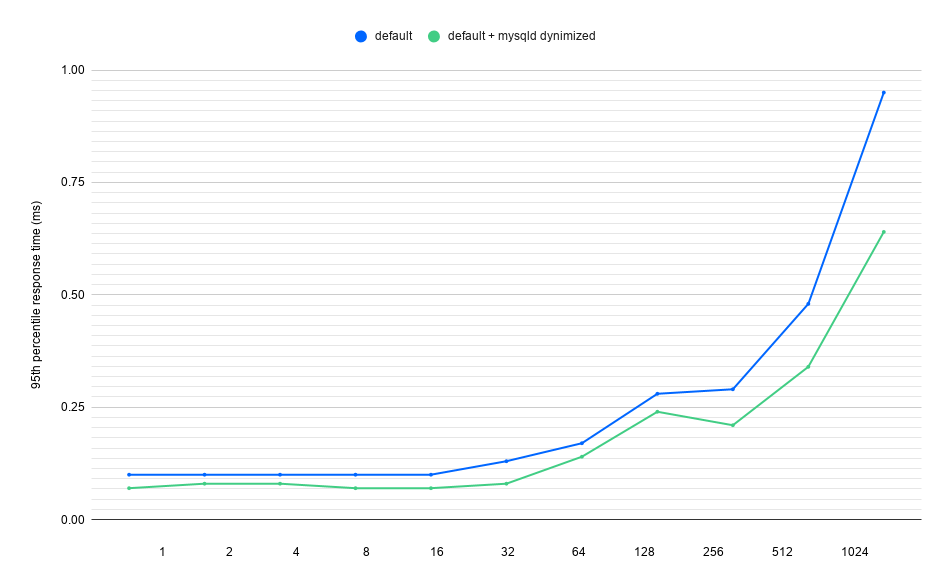
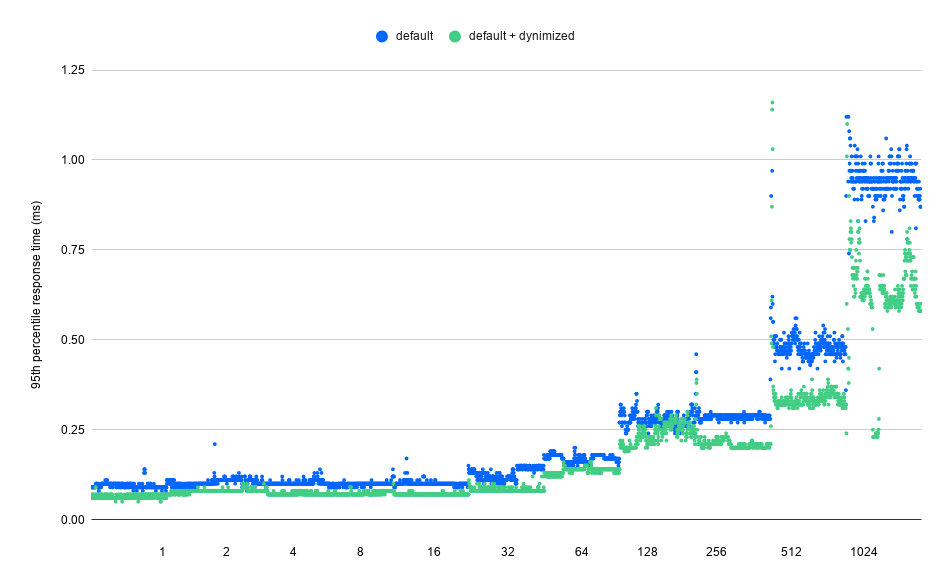
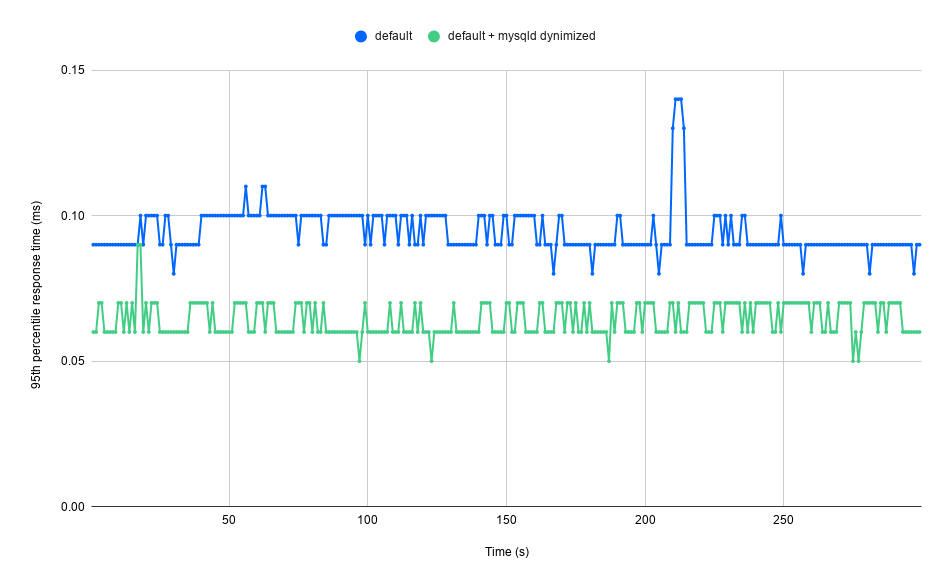
I would argue that the above response time improvements at all concurrency levels are the most valuable benefit Dynimize will provide to most real-world use cases.
Disabling Spectre/Meltdown Mitigations
Maybe at this point, you're wondering why the baseline performance when using TCP/IP connections without Dynimize is only 1.6M QPS for a relatively newer server with 224 vCores, compared to 2.1M QPS on an older Broadwell based server with 96 physical cores at 196 hardware threads. Is KVM virtualization overhead the only thing holding back these results? Seeing that the old record was set in Oct 2017 just a few months before the Spectre and Meltdown mitigations were introduced into Linux, I felt that these mitigations were an obvious place to look. Let's try disabling the mitigations within Linux by setting the following in /etc/default/grub:
GRUB_CMDLINE_LINUX="spectre_v2=off nopti spec_store_bypass_disable=off"
Here is a comparison of the performance without Dynimize with and without these mitigations enabled.
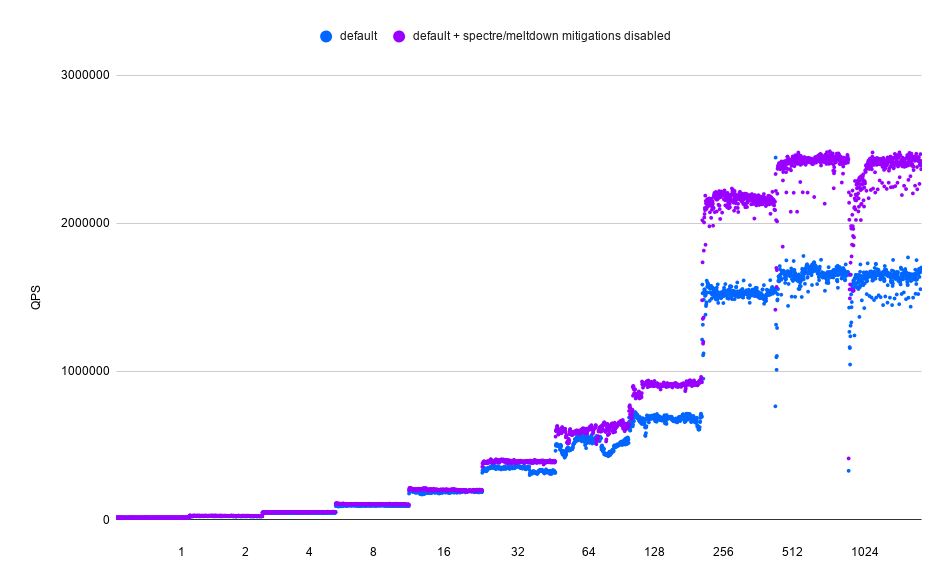
Our baseline without Dynimize has gone from 1.6M QPS to 2.39M QPS by simply disabling these mitigations. That is a massive boost that is quite shocking to me. My suspicions are that some of the mitigations enabled by default may not be necessary on AMD Rome systems, or potentially some of these mitigations are not well-tuned for these processors. Regardless of the cause, the same experiment with mysqld dynimized gives the following:
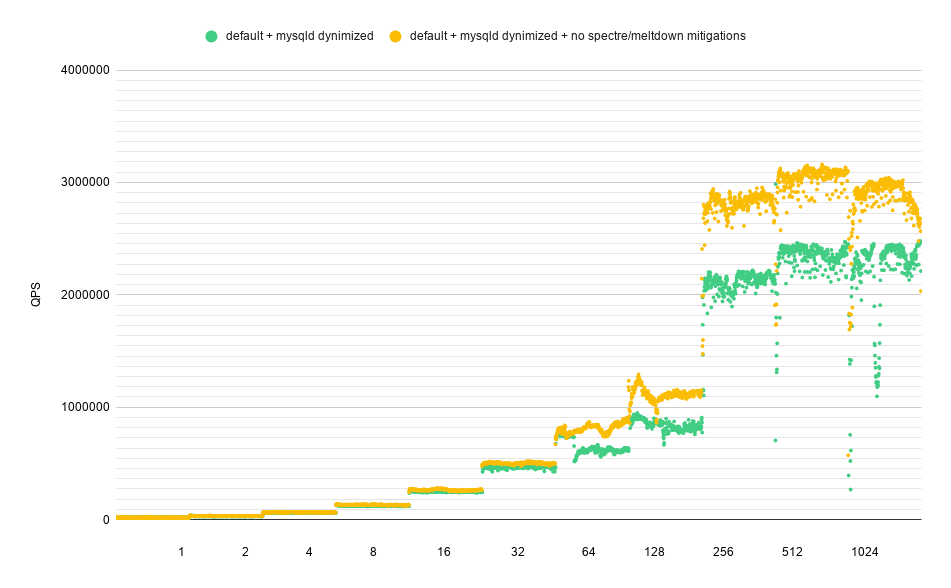
We are now at over 3M QPS on a single virtual machine by dynimizing mysqld. That's pretty amazing! Now, what else can we do?
TCP/IP vs Unix Sockets
Seeing that we're running Sysbench and MySQL on the same server, we can connect to MySQL using a Unix socket file and bypass the TPC/IP stack with its associated overhead. Below are the results.
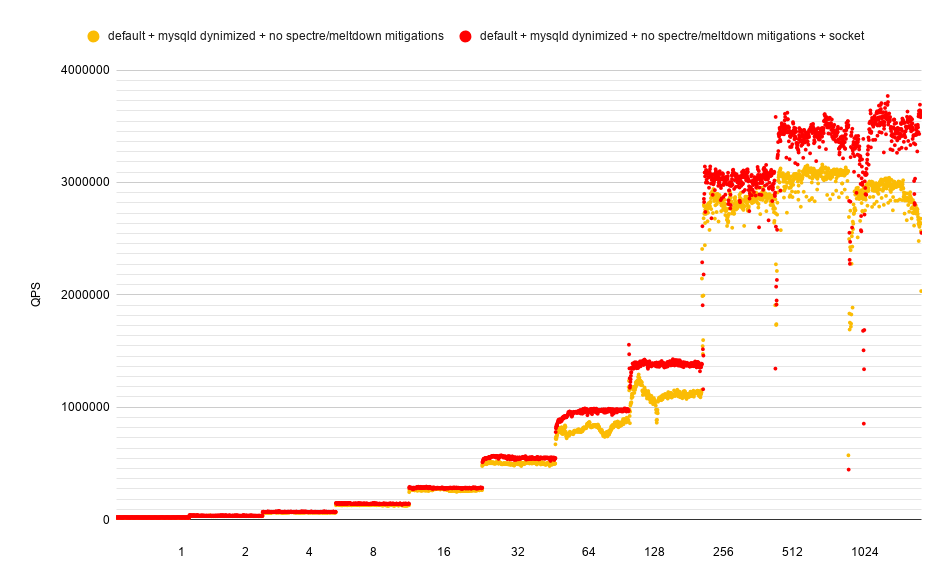
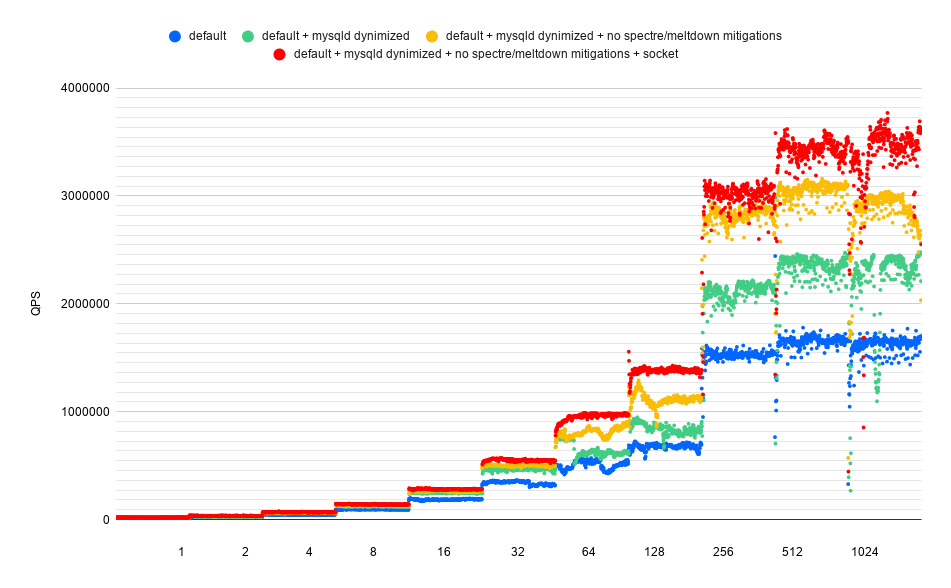
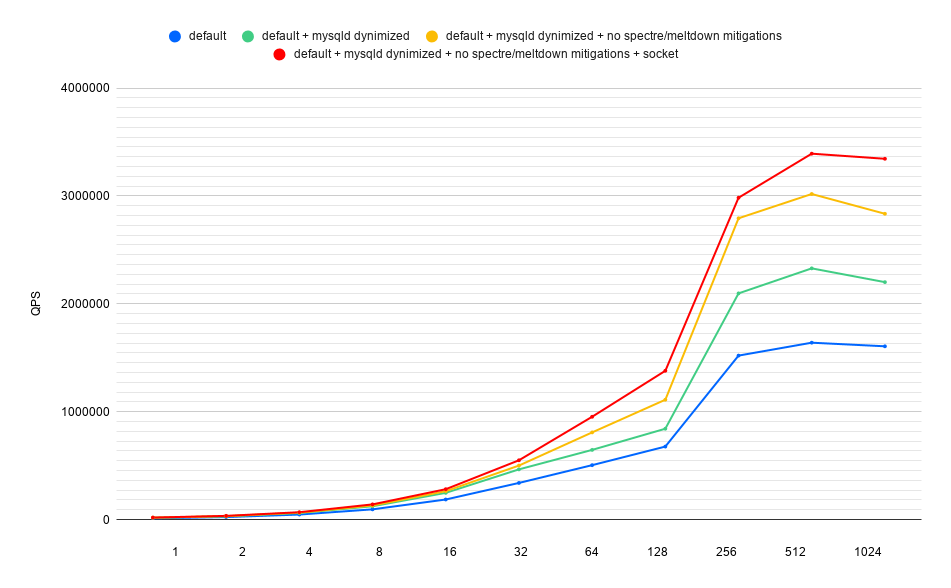
As you can see we get a nice boost here using the Unix socket file, lifting peak throughput to 3.4M QPS with all other enhancements enabled. That compares favorably to the previous Unix socket record of 2.25M QPS that would not have included any Spectre and Meltdown mitigations. Below are graphs of all these performance enhancements combined.
Dynimizing the Sysbench Process
Sysbench is based on the Lua scripting language and has undergone many improvements to reduce the overhead of the sysbench process. It was bundled with LuaJIT for exactly that reason; however, like other programs that include JIT compilers, its performance still relies heavily on the machine code of its actual executable (in this case the sysbench executable) along with the shared libraries that all programs rely on. That of course leaves us with an opportunity for Dynimize to dynamically compile and optimize with profile guided optimizations the executable machine code within sysbench that isn't running in the LuaJIT code cache.
Dynimize works in this context because it automatically ignores anonymous code regions that can potentially be a JIT code cache and only targets the executable and shared library code regions. So to target the sysbench process I simply add sysbench under [exeList] in /etc/dyni.conf. The challenge here is that because you need to start a new sysbench process every time you want to increase the number of threads/connections, each new sysbench process must become dynimized again. This results in dynimizing overhead and a delay before sybench reaches the dynimized state, interfering with the results.
Since we're trying to set a QPS record, we'd like to see everything fully dynimized before measurements begin. To do this I run Sysbench with Dynimize however only include the data points after the dynimizing warmup period is complete. To simplify the post-processing step I only do this for one run at 512 connections.
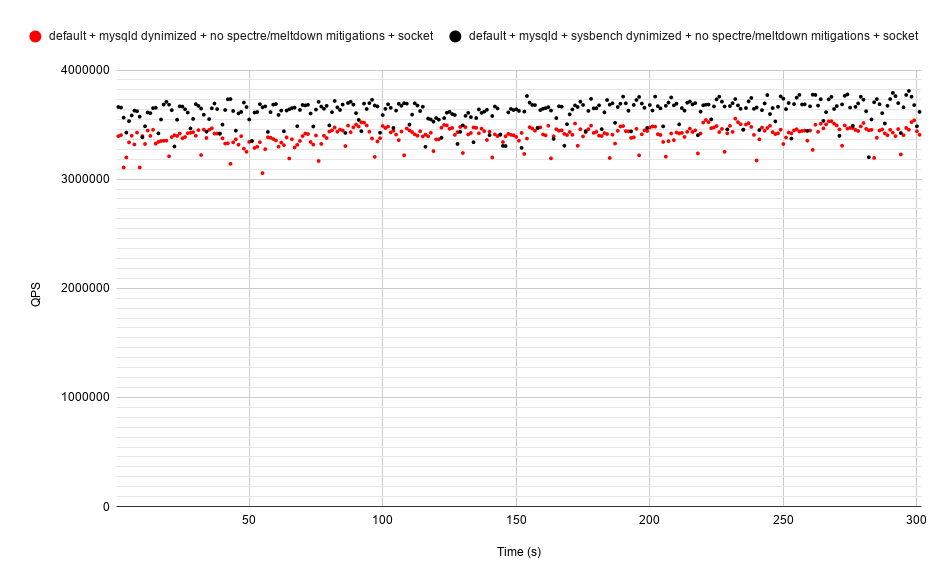
The above graph plots QPS at one-second intervals with and without sysbench dynimized after the warmup period. In both runs, we have mysqld dynimized, along with the Spectre and Meltdown mitigations disabled using a Unix socket file for communication. Here you can see that dynimizing the sysbench process provides for an additional boost in QPS, bringing the sustained average throughput to our new 3.6M QPS record.
Wrap Up
Well, that was fun! In the end, we saw a 44% QPS increase after dynimizing mysqld vs baseline, and over 3.6 million queries per second on this single VM server with MySQL 8.0 after all performance enhancements were combined. Beyond that, we were also able to achieve these improvements with Dynimize down to the single threaded case. More importantly, we measured response time reductions with Dynimize of up to 38% with significant reductions at every concurrency level.
This post also shows us how accessible large servers are becoming in the cloud. To be able to push 3.6 million queries per second on a single cloud VM instance using a free open source RDBMS is a testament to what is possible today in the modern cloud. I also found it very interesting that the instances with the most CPU performance available right now on Google Compute Platform are base on AMD EPYC 2 processors. Unfortunately, we also saw that the current default Spectre and Meltdown mitigations enabled within Linux on this system incur a massive performance penalty with this workload, and it was necessary to disable them to perform a more apples-to-apples comparison of the previous max MySQL QPS record on a single server.
From this we can see that Dynimize is necessary to achieve the very best possible performance for certain MySQL workloads, such as this one involving well-indexed point selects hitting the InnoDB buffer pool. It also shows a clear performance upgrade path for those wishing to see CPU-side performance improvements with MySQL without having to 1) migrate to a new server, 2) take the risk of modifying your app or infrastructure, or 3) restart MySQL with the associated downtime.

