Java Code Coverage in Eclipse
People often think that Java code coverage tools are only used for testing. I beg to differ. I was recently investigating a JVM crash issue and had been interested in seeing which lines of code among those that were run could have had an influence on the crash.
To help with this, I used a tool that I recently discovered and have been using ever since called the EclEmma Java code coverage plugin. It’s for Eclipse and it’s free.
It’s very simple and intuitive and has all you would expect from a code coverage tool. With it, you can:
- See code coverage for a java application that you’ve run (and potentially merge multiple run instances)
- See code coverage for jUnit tests and maven tests
- See which classes have which amount of coverage.
- And more!
To use it, you can either right-click on a class and then find and click Code Coverage > Run As, or you can just hit the Run As Code Coverage button that looks like the regular Run button (shown here):

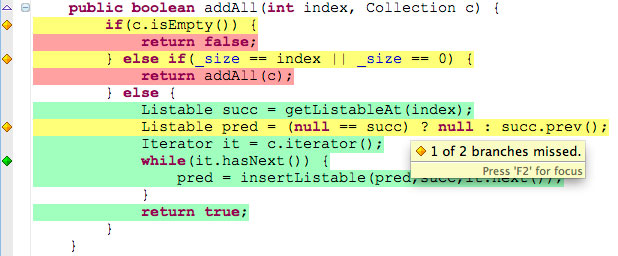
In the screenshot below, the colors are fairly self-explanatory. The color yellow means that it ran into a conditional (if/select/try) and only executed one branch.

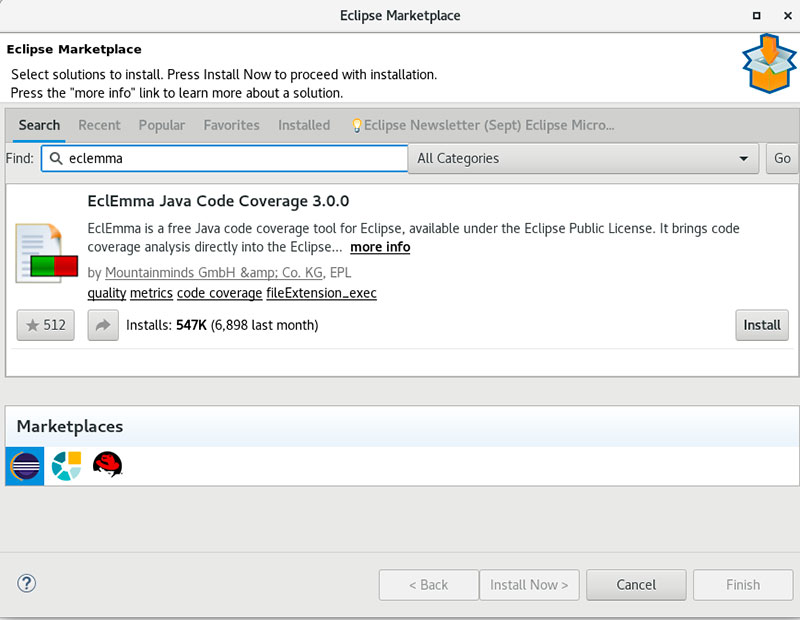
To install EclEmma, just search for ‘eclemma’ in the marketplace:

If you decide to try this plugin out, I recommend you read the EclEmma user guide to get acquainted with all of its features (it’s fairly short, only 15 mins of reading).

