Highly Available Prometheus Metrics for Distributed SQL With Thanos on GKE
In the last few years, Prometheus has gained huge popularity as a tool for monitoring distributed systems. It has a simple yet powerful data model and query language, however, it can often pose a bit of a challenge when it comes to high availability as well as for historical metric data storage. Adding more Prometheus replicas can be used to improve availability, but otherwise, Prometheus does not offer continuous availability.
For example, if one of the Prometheus replicas crashes, there will be a gap in the metric data during the time it takes to failover to another Prometheus instance. Similarly, Prometheus’s local storage is limited in scalability and durability given its single-node architecture. You will have to rely on a remote storage system to solve the long-term data retention problem. This is where the CNCF sandbox project Thanos comes in handy.
Thanos is a set of components that can be composed into a highly available metrics system with unlimited storage capacity on GCP, S3, or other supported object stores, and runs seamlessly on top of existing Prometheus deployments. Thanos allows you to query multiple Prometheus instances at once and merges data for the same metric across multiple instances on the fly to produce a continuous stream of monitoring logs. Even though Thanos is an early-stage project, it is already used in production by companies like Adobe and eBay.
Because YugabyteDB is a cloud native, distributed SQL database, it can easily interoperate with Thanos and many other CNCF projects like Longhorn, OpenEBS, Rook, and Falco.
What’s YugabyteDB? It is an open source, high-performance distributed SQL database built on a scalable and fault-tolerant design inspired by Google Spanner. Yugabyt is PostgreSQL wire compatible.
In this blog post, we’ll show you how to get up and running with Thanos so that it can be used to monitor a YugabyteDB cluster, all running on Google Kubernetes Engine (GKE).
Thanos Architecture
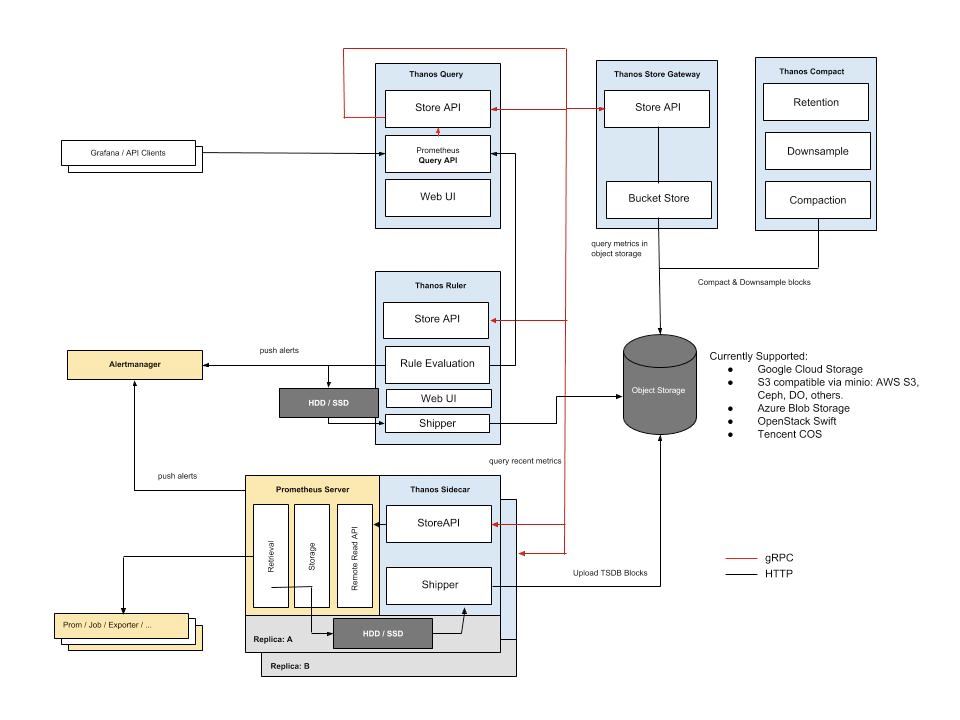
At a high level, Thanos has several key components worth understanding how they work.
- First, a sidecar is deployed alongside the Prometheus container and interacts with Prometheus.
- Next, an additional service called Thanos Query is deployed. It is configured to be aware of all instances of the Thanos Sidecar. Instead of querying Prometheus directly, you query the Thanos Query component.
- Thanos Query communicates with the Thanos Sidecar via gRPC and de-duplicates metrics across all instances of Prometheus when executing a query. Thanos Query also delivers a graphical user interface for querying and administration, plus exposes the Prometheus API.
An illustration of the components is shown below. You can learn more about the Thanos architecture by checking out the documentation.
Why Thanos and YugabyteDB
Because YugabyteDB already integrates with Prometheus, Thanos can be used as a resilient monitoring platform for YugabyteDB clusters that can also store the metric data long term. It ensures the continuous availability of YugabyteDB metric data by aggregating the data from multiple Prometheus instances into a single view.
Prerequisites
Here is the environment required for the setup:
- Yugabyte DB – Version 2.1.6
- Prometheus Operator – Version 2.2.1
- Thanos – Version 0.12.2
- All the above will be installed on Google Kubernetes Engine using Helm 3
- A Google Cloud Platform account
Setting Up a Kubernetes Cluster on Google Cloud Platform
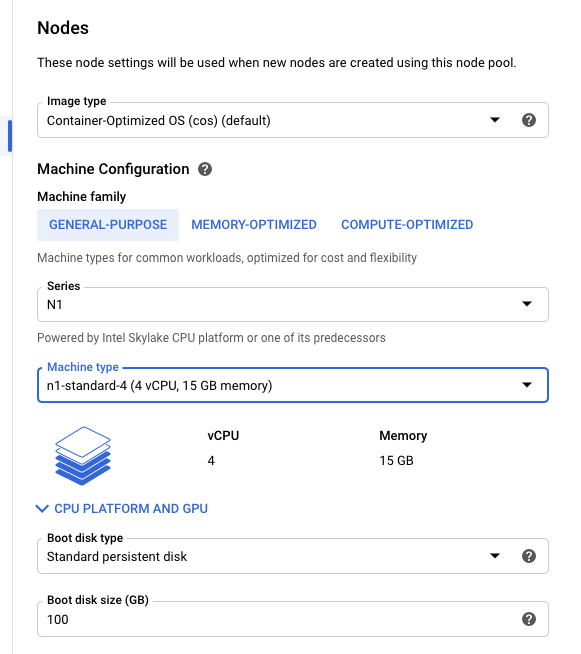
Assuming you have a Google Cloud Platform account, the first step is to set up a Kubernetes cluster using GKE.
The usual defaults should be sufficient. For the purposes of this demo, I chose Machine type: n-1-standard-4 (4 vCPU, 15 GB memory).
Install YugabyteDB on GKE With Helm
Once your Kubernetes cluster is up and running, log into the shell, and work through the following commands to get a YugabyteDB cluster deployed using Helm 3.
Create a Namespace
$ kubectl create namespace yb-demo
Add the Charts Repository
xxxxxxxxxx
$ helm repo add yugabytedb https://charts.yugabyte.com
Fetch Updates From the Repository
xxxxxxxxxx
$ helm repo update
Install YugabyteDB
We are now ready to install YugabyteDB. In the command below, we’ll be specifying values for a resource constrained environment.
xxxxxxxxxx
$ helm install yb-demo yugabytedb/yugabyte \
--set resource.master.requests.cpu=0.5, \ resource.master.requests.memory=0.5Gi,\
resource.tserver.requests.cpu=0.5, \ resource.tserver.requests.memory=0.5Gi --namespace yb-demo
To check the status of the YugabyteDB cluster, execute the command below:
xxxxxxxxxx
$ helm status yb-demo -n yb-demo
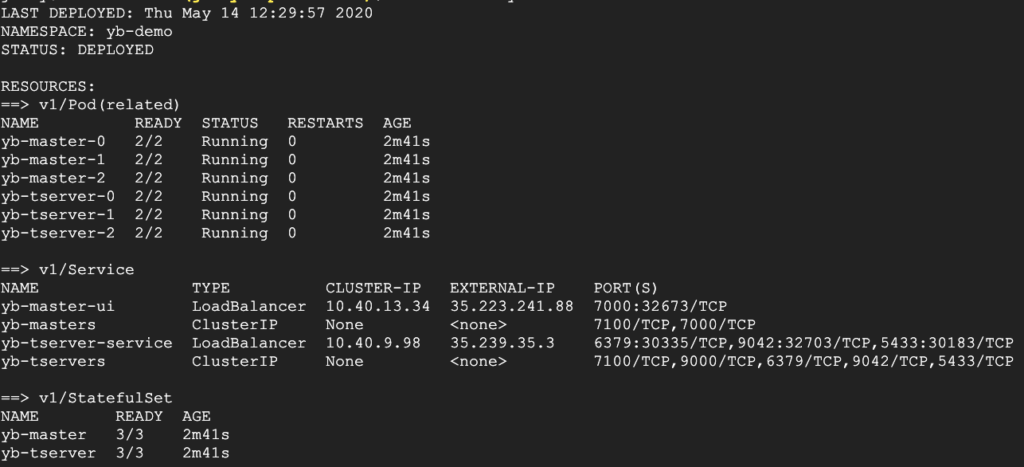
From the screenshot above we can see that the external IP is 35.239.35.3 and that the YSQL port is 5433. You can use this information to connect to YugabyteDB with your favorite database admin tool, like DBeaver, pgAdmin, and TablePlus. For more information, check out the third-party tools documentation.
Congrats! At this point, you have a three-node YugabyteDB cluster running on GKE.
Setting Up the Prometheus Operator
For the purposes of this blog, we will be using the Prometheus Operator deployed via Helm 3 to get Prometheus up and running.
Create a values.yaml File
By default, Helm charts install multiple components that are not required to run Thanos with Prometheus. Also, since our cluster has limited resources, we need to override the default configuration by creating a new values.yaml file and passing this file when we install the Prometheus Operator using Helm.
xxxxxxxxxx
$ touch values.yaml
$ vim values.yaml
The file’s contents should look like this:
xxxxxxxxxx
defaultRules
createfalse
alertmanager
enabledfalse
grafana
enabledfalse
kubeApiServer
enabledfalse
kubelet
enabledfalse
kubeControllerManager
enabledfalse
coreDns
enabledfalse
kubeEtcd
enabledfalse
kubeScheduler
enabledfalse
kubeStateMetrics
enabledfalse
nodeExporter
enabledfalse
prometheus
enabledfalse
Install Prometheus
Install the Prometheus Operator via Helm 3 as shown below.
xxxxxxxxxx
$ kubectl create namespace prometheus
$ helm repo add stable https://kubernetes-charts.storage.googleapis.com
$ helm repo update
$ helm install prometheus-operator stable/prometheus-operator \
--namespace prometheus \
--values values.yaml
You can verify that the Prometheus Operator is installed using the following command:
xxxxxxxxxx
$ kubectl get pods -n prometheus

To avoid the scenario of metrics being unavailable, either permanently or for a short duration of time, we can run a second instance of Prometheus. Each instance of Prometheus will run independent of the other, however each instance will still have the same configuration as set by the Prometheus Operator. You can see this implementation detail in the bolded section below where we specify 2 replicas.
Create a file called prometheus.yaml
xxxxxxxxxx
$ touch prometheus.yaml
$ vim prometheus.yaml
Add the following configuration:
xxxxxxxxxx
apiVersionmonitoring.coreos.com/v1
kindPrometheus
metadata
nameprometheus
namespaceprometheus
spec
baseImagequay.io/prometheus/prometheus
logLevelinfo
podMetadata
annotations
cluster-autoscaler.kubernetes.io/safe-to-evict"true"
labels
appprometheus
replicas2
resources
limits
cpu100m
memory2Gi
requests
cpu100m
memory2Gi
retention12h
serviceAccountNameprometheus-service-account
serviceMonitorSelector
matchLabels
serviceMonitorSelectorprometheus
storage
volumeClaimTemplate
apiVersionv1
kindPersistentVolumeClaim
metadata
nameprometheus-pvc
spec
accessModes
ReadWriteOnce
resources
requests
storage10Gi
versionv2.10.0
securityContext
fsGroup0
runAsNonRootfalse
runAsUser0
---
apiVersionv1
kindServiceAccount
metadata
name"prometheus-service-account"
namespace"prometheus"
---
apiVersionrbac.authorization.k8s.io/v1
kindClusterRole
metadata
name"prometheus-cluster-role"
rules
apiGroups
""
resources
nodes
services
endpoints
pods
verbs
get
list
watch
apiGroups
""
resources
nodes/metrics
verbs
get
nonResourceURLs
"/metrics"
verbs
get
---
apiVersionrbac.authorization.k8s.io/v1
kindClusterRoleBinding
metadata
name"prometheus-cluster-role-binding"
roleRef
apiGrouprbac.authorization.k8s.io
kindClusterRole
name"prometheus-cluster-role"
subjects
kindServiceAccount
name"prometheus-service-account"
namespaceprometheus
Next, apply the promethus.yaml file to the Kubernetes cluster using the following command:
xxxxxxxxxx
$ kubectl apply -f prometheus.yaml
You can verify that the Prometheus Operator is installed using the following command:
xxxxxxxxxx
$ kubectl get pods -n prometheus
You should see output like that shown below with two Prometheus pods now running:

Configuring Prometheus PVC
The Prometheus persistent volume claim (PVC) is used to retain the state of Prometheus and the metrics it captures in the event that it is upgraded or restarted. To verify that the PVC that has been created and bound to a persistent volume run the following command:
xxxxxxxxxx
$ kubectl get persistentvolumeclaim --namespace prometheus
You should see output like that shown below:

To access the Prometheus UI we need to first run the following command:
xxxxxxxxxx
$ kubectl port-forward service/prometheus-operated 9090:9090 --namespace prometheus
Now, go to Web preview in Google Console and select Change port > 9090. You should now see the Prometheus web UI, similar to the one shown below:

Configuring Prometheus to Monitor YugabyteDB
The next step is to configure Prometheus to scrape YugabyteDB metrics. Create a file named servicemonitor.yaml with the following content:
xxxxxxxxxx
apiVersionmonitoring.coreos.com/v1
kindServiceMonitor
metadata
labels
serviceMonitorSelectorprometheus
nameprometheus
namespaceprometheus
spec
endpoints
interval30s
targetPort7000
path/prometheus-metrics
namespaceSelector
matchNames
yb-demo
selector
matchLabels
app"yb-master"
We can now apply the servicemonitor.yaml configuration by running the following command:
xxxxxxxxxx
$ kubectl apply -f servicemonitor.yaml
Verify that the configuration has been applied by running the following command:
xxxxxxxxxx
$ kubectl get servicemonitor --namespace prometheus
You should see output similar to the one shown below.

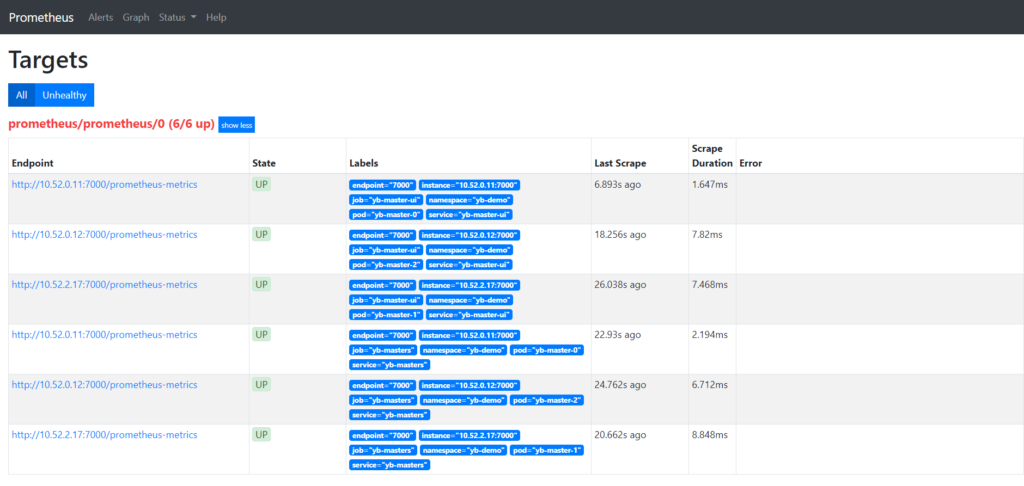
Now, return to the Prometheus UI to verify that the YugabyteDB metric endpoints are available to Prometheus by going to Status > Targets.
Setting Up Thanos
Add the following Thanos specific configurations to the prometheus.yaml file under the spec section that starts at line 7:
xxxxxxxxxx
spec
baseImagequay.io/prometheus/prometheus
logLevelinfo
podMetadata
annotations
cluster-autoscaler.kubernetes.io/safe-to-evict"true"
labels
appprometheus
thanos-store-api"true"
replicas2
thanos
versionv0.4.0
resources
limits
cpu10m
memory50Mi
requests
cpu10m
memory50Mi
resources
limits
cpu100m
memory2Gi
requests
cpu100m
memory2Gi
retention12h
serviceAccountNameprometheus-service-account
serviceMonitorSelector
matchLabels
serviceMonitorSelectorprometheus
externalLabels
cluster_environmentworkshop
storage
volumeClaimTemplate
apiVersionv1
kindPersistentVolumeClaim
metadata
nameprometheus-pvc
spec
accessModes
ReadWriteOnce
resources
requests
storage10Gi
Finally, add the following Thanos deployment configuration to the end of the prometheus.yaml file:
xxxxxxxxxx
---
apiVersionapps/v1
kindDeployment
metadata
namethanos-query
namespaceprometheus
labels
appthanos-query
spec
replicas1
selector
matchLabels
appthanos-query
template
metadata
labels
appthanos-query
spec
containers
namethanos-query
imageimprobable/thanosv0.5.0
resources
limits
cpu50m
memory100Mi
requests
cpu50m
memory100Mi
args
"query"
"--log.level=debug"
"--query.replica-label=prometheus_replica"
"--store.sd-dns-resolver=miekgdns"
"--store=dnssrv+_grpc._tcp.thanos-store-api.prometheus.svc.cluster.local"
ports
namehttp
containerPort10902
namegrpc
containerPort10901
namecluster
containerPort10900
---
apiVersionv1
kindService
metadata
name"thanos-store-api"
namespaceprometheus
spec
typeClusterIP
clusterIPNone
ports
namegrpc
port10901
targetPortgrpc
selector
thanos-store-api"true"
We are now ready to apply the configuration by running the following command:
xxxxxxxxxx
$ kubectl apply -f prometheus.yaml
Verify that the pods are running by running the following command:
xxxxxxxxxx
$ kubectl get pods --namespace prometheus
Notice that we now have Thanos running.

Connect to the Thanos UI
Connect to Thanos Query by using port forwarding. You can do this by running the following command replacing the thanos-query pod name with your own:
xxxxxxxxxx
$ kubectl port-forward pod/thanos-query-7f77667897-lfmlb 10902:10902 --namespace prometheus
We can now access the Thanos Web UI, using the web preview with port 10902.
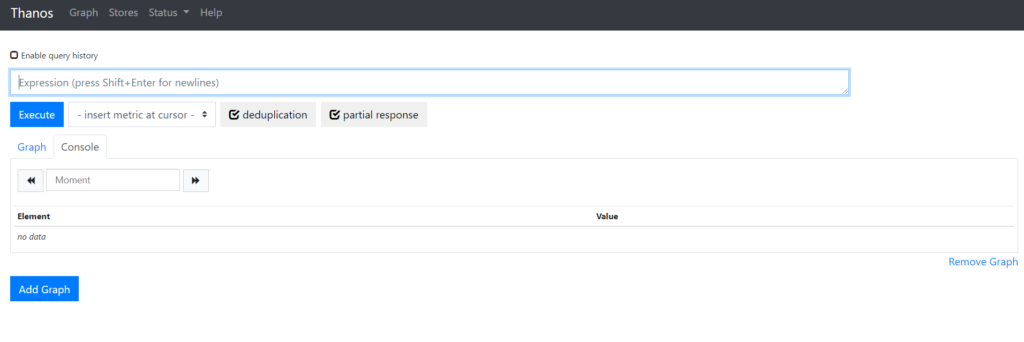
Verify that Thanos is able to access both Prometheus replicas by clicking on Stores.

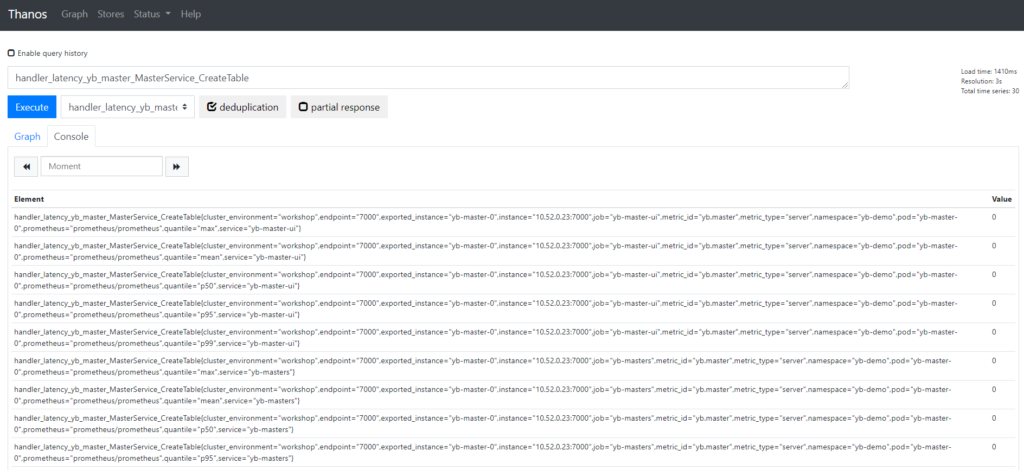
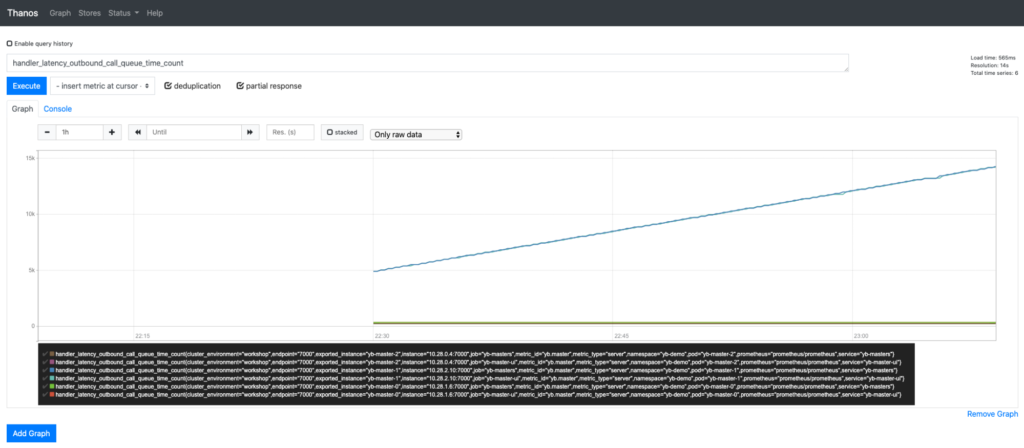
The YugabyteDB metric data is now available to Thanos through both Prometheus instances. A few examples are below:
Conclusion
That’s it! You now have a YugabyteDB cluster running on GKE that is being monitored by two Prometheus instances, which not only made highly available but also appear as one, with Thanos. For more information, check out the documentation on YugabyteDB metrics and integration with Prometheus.

