Monitor Your Infrastructure With InfluxDB and Grafana on Kubernetes
Monitoring your infrastructure and applications is a must-have if you play your game seriously. Overseeing your entire landscape, running servers, cloud spends, VMs, containers, and the applications inside are extremely valuable to avoid outages or to fix things quicker. We at Starschema rely on open-source tools like InfluxDB, Telegraf, Grafana, and Slack to collect, analyze, and react to events. In this blog series, I will show you how we built our monitoring infra to monitor our cloud infrastructure, applications like Tableau Server and Deltek Maconomy, and data pipelines in Airflow, among others.
In this part, we will build up the basic infrastructure monitoring with InfluxDB, Telegraf, and Grafana on Amazon’s managed Kubernetes service: AWS EKS.
Create a New EKS Kubernetes Cluster
If you have an EKS cluster already, just skip this part.
I assume you have a properly set up aws cli on your computer — if not, then please do it, it will be a life-changer. Anyway, first, install eksctl which will help you to manage your AWS Elastic Kubernetes Service clusters and will save tons of time by not requiring to rely on the AWS Management Console. Also, you will need kubectl, too.
First, create new a Kubernetes cluster in AWS using eksctl without a nodegroup:
eksctl create cluster --name "StarKube" --version 1.18 --region=eu-central-1 --without-nodegroup
I used eu-central-1 region, but you can pick another one that is closer to you. After the command completes, add a new nodegroup to the freshly created cluster that uses only one availability zone (AZ):
xxxxxxxxxx
eksctl create nodegroup --cluster=StarKube --name=StarKube-default-ng --nodes-min 1 --nodes-max 4 --node-volume-size=20 --ssh-access --node-zones eu-central-1b --asg-access --tags "Maintainer=tfoldi" --node-labels "ngrole=default" --managed
The reason why I created a single AZ nodegroup is to be able to use EBS backed persistent volumes along with EC2 autoscaling groups. On multi-AZ node groups with autoscaling, newly created nodes can be in a different zone, without access to the existing persistent volumes (which are AZ specific). More info about this here.
TL;DR: Use single-zone nodegroups if you have EBS PersistentVolumeClaims.
If things are fine, you should see a node in your cluster:
xxxxxxxxxx
$ kubectl get nodes
AGE VERSION
ip-192-168-36-245.eu-central-1.compute.internal Ready <none> 16s v1.18.9-eks-d1db3c
Create a Namespace for Monitoring Apps
Kubernetes namespaces are isolated units inside the cluster. To create our own monitoring namespace we should simply execute:
xxxxxxxxxx
kubectl create namespace monitoring
For our convenience, let’s use the monitoring namespace as the default one:
xxxxxxxxxx
kubectl config set-context --current --namespace=monitoring
Install InfluxDB on Kubernetes
Influx is a time-series database, with easy to use APIs and good performance. If you are not familiar with time-series databases, it is time to learn: they support special query languages designed to work with time-series data, or neat functions like downsampling and retention.
To install an application to our Kubernetes system, usually we
- (Optional) Create the necessary secrets as an Opaque
Secret(to store sensitive configurations). - (Optional) Create a
ConfigMapto store non-sensitive configurations. - (Optional) Create a
PersistentVolumeClaimto store any persistent data (think of volumes for your containers). - Create a
DeploymentorDaemonSetfile to specify the container-related stuff like whatwe are going to run. - (Optional) Create a
Servicefile explaining howwe are going to access theDeployment.
As stated, the first thing we need to do is to define ourSecrets: usernames and passwords we want to use for our database.
xxxxxxxxxx
kubectl create secret generic influxdb-creds \
--from-literal=INFLUXDB_DB=monitoring \
--from-literal=INFLUXDB_USER=user \
--from-literal=INFLUXDB_USER_PASSWORD=<password> \
--from-literal=INFLUXDB_READ_USER=readonly \
--from-literal=INFLUXDB_USER_PASSWORD=<password> \
--from-literal=INFLUXDB_ADMIN_USER=root \
--from-literal=INFLUXDB_ADMIN_USER_PASSWORD=<password> \
--from-literal=INFLUXDB_HOST=influxdb \
--from-literal=INFLUXDB_HTTP_AUTH_ENABLED=true
Next, create some persistent storage to store the database itself:
xxxxxxxxxx
---
apiVersion: v1
kind: PersistentVolumeClaim
metadata:
namespace: monitoring
labels:
app: influxdb
name: influxdb-pvc
spec:
accessModes:
- ReadWriteOnce
resources:
requests:
storage: 5Gi
If you are new to Kubernetes, the way to execute these files is to call kubectl apply -f <filename> , in our case kubectl apply -f influxdb-pvc.yml.
Now, let’s create the Deployment, that defines what containers we need and how:
xxxxxxxxxx
---
apiVersion: apps/v1
kind: Deployment
metadata:
namespace: monitoring
labels:
app: influxdb
name: influxdb
spec:
replicas: 1
selector:
matchLabels:
app: influxdb
template:
metadata:
labels:
app: influxdb
spec:
containers:
- envFrom:
- secretRef:
name: influxdb-creds
image: docker.io/influxdb:1.8
name: influxdb
volumeMounts:
- mountPath: /var/lib/influxdb
name: var-lib-influxdb
volumes:
- name: var-lib-influxdb
persistentVolumeClaim:
claimName: influxdb-pvc
It will create a single pod (since replicas=1), passing our influxdb-creds as environmental variables and influxdb-pvc PersistentVolumeClaim to obtain 5GB storage for the database files. If all good, we should see something like:
xxxxxxxxxx
[tfoldi@kompi]% kubectl get pods -l app=influxdb
NAME READY STATUS RESTARTS AGE
influxdb-7f694df996-rtdcz 1/1 Running 0 16m
After we defined what we want to run, it’s time for how to access it? This where Service definition comes into the picture. Let’s start with a basic LoadBalancer service:
xxxxxxxxxx
apiVersion: v1
kind: Service
metadata:
labels:
app: influxdb
name: influxdb
namespace: monitoring
spec:
ports:
- port: 8086
protocol: TCP
targetPort: 8086
selector:
app: influxdb
type: LoadBalancer
It tells that our pod’s 8088 port should be available thru an Elastic Load Balancer (ELB). With kubectl get service, we should see the external-facing host:port (assuming we want to monitor apps outside from our AWS internal network).
xxxxxxxxxx
$ kubectl get service/influxdb
NAME TYPE CLUSTER-IP EXTERNAL-IP PORT(S) AGE
influxdb LoadBalancer 10.100.15.18 ade3d20c142394935a9dd33c336b3a0f-2034222208.eu-central-1.elb.amazonaws.com 8086:30651/TCP 18h$ curl http://ade3d20c142394935a9dd33c336b3a0f-2034222208.eu-central-1.elb.amazonaws.com:8086/ping
This is great, but instead of HTTP, we might want to use HTTPS. To do that, we need our SSL certification in ACM with the desired hostname. We can either do it by generating a new certificate (requires Route53 hosted zones) or upload our external SSL certificate.
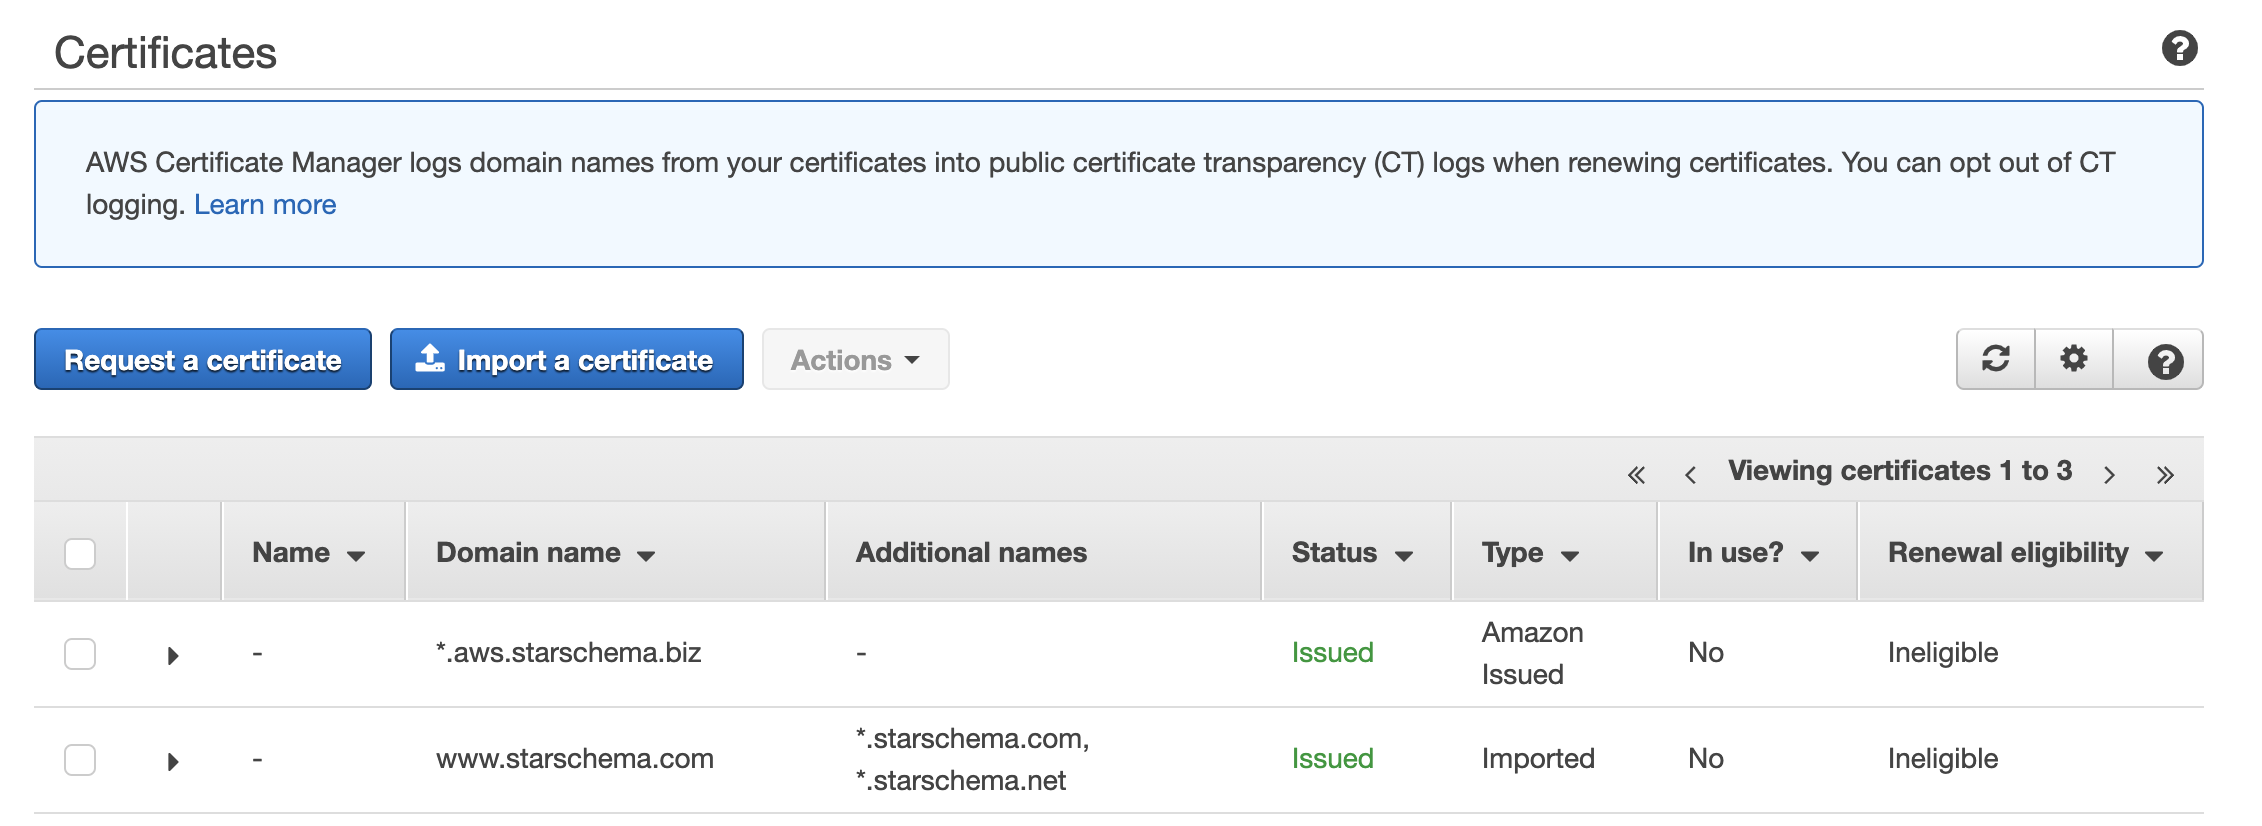
If we have our certificate in ACM, we should add it to the Service file:
xxxxxxxxxx
apiVersion: v1
kind: Service
metadata:
annotations:
# Note that the backend talks over HTTP.
service.beta.kubernetes.io/aws-load-balancer-backend-protocol: http
# TODO: Fill in with the ARN of your certificate.
service.beta.kubernetes.io/aws-load-balancer-ssl-cert: arn:aws:acm:{region}:{user id}:certificate/{id}
# Only run SSL on the port named "https" below.
service.beta.kubernetes.io/aws-load-balancer-ssl-ports: "https"
labels:
app: influxdb
name: influxdb
namespace: monitoring
spec:
ports:
- port: 8086
targetPort: 8086
name: http
- port: 443
name: https
targetPort: 8086
selector:
app: influxdb
type: LoadBalancer
After executing this file, we can see that our ELB listens on two ports:
xxxxxxxxxx
[tfoldi]% kubectl get services/influxdb
NAME TYPE CLUSTER-IP EXTERNAL-IP PORT(S) AGE
influxdb LoadBalancer 10.100.15.18 ade3d20c142394935a9dd33c336b3a0f-2034222208.eu-central-1.elb.amazonaws.com 8086:30651/TCP,443:31445/TCP 18h
SSL is properly configured, the only thing is missing to add an A or CNAME record pointing to EXTERNAL-IP .
We all set, our database is running, and it is available on both HTTP and HTTPS protocols.
Installing Telegraf on Kubernetes
We need some data to validate our installation, and by the way, we already have a system to monitor: our very own Kube cluster and its containers. To do this, we will install Telegraf on all nodes and ingest cpu, IO, docker metrics into our InfluxDB. Telegraf has tons of plugins to collect data from almost everything: infrastructure elements, log files, web apps, and so on.
The configuration will be stored as ConfigMap, this is what we are going to pass to our containers:
xxxxxxxxxx
apiVersion: v1
kind: ConfigMap
metadata:
name: telegraf
namespace: monitoring
labels:
k8s-app: telegraf
data:
telegraf.conf: |+
[global_tags]
env = "EKS eu-central"
[agent]
hostname = "$HOSTNAME"
[[outputs.influxdb]]
urls = ["http://$INFLUXDB_HOST:8086/"] # required
database = "$INFLUXDB_DB" # required timeout = "5s"
username = "$INFLUXDB_USER"
password = "$INFLUXDB_USER_PASSWORD" [[inputs.cpu]]
percpu = true
totalcpu = true
collect_cpu_time = false
report_active = false
[[inputs.disk]]
ignore_fs = ["tmpfs", "devtmpfs", "devfs"]
[[inputs.diskio]]
[[inputs.kernel]]
[[inputs.mem]]
[[inputs.processes]]
[[inputs.swap]]
[[inputs.system]]
[[inputs.docker]]
endpoint = "unix:///var/run/docker.sock"
To run our Telegraf data collector on all nodes of our Kubernetes cluster, we should use DaemonSet instead of Deployments.
xxxxxxxxxx
apiVersion: apps/v1
kind: DaemonSet
metadata:
name: telegraf
namespace: monitoring
labels:
k8s-app: telegraf
spec:
selector:
matchLabels:
name: telegraf
template:
metadata:
labels:
name: telegraf
spec:
containers:
- name: telegraf
image: docker.io/telegraf:1.5.2
env:
- name: HOSTNAME
valueFrom:
fieldRef:
fieldPath: spec.nodeName
- name: "HOST_PROC"
value: "/rootfs/proc"
- name: "HOST_SYS"
value: "/rootfs/sys"
- name: INFLUXDB_USER
valueFrom:
secretKeyRef:
name: influxdb-creds
key: INFLUXDB_USER
- name: INFLUXDB_USER_PASSWORD
valueFrom:
secretKeyRef:
name: influxdb-creds
key: INFLUXDB_USER_PASSWORD
- name: INFLUXDB_HOST
valueFrom:
secretKeyRef:
name: influxdb-creds
key: INFLUXDB_HOST
- name: INFLUXDB_DB
valueFrom:
secretKeyRef:
name: influxdb-creds
key: INFLUXDB_DB
volumeMounts:
- name: sys
mountPath: /rootfs/sys
readOnly: true
- name: proc
mountPath: /rootfs/proc
readOnly: true
- name: docker-socket
mountPath: /var/run/docker.sock
- name: utmp
mountPath: /var/run/utmp
readOnly: true
- name: config
mountPath: /etc/telegraf
terminationGracePeriodSeconds: 30
volumes:
- name: sys
hostPath:
path: /sys
- name: docker-socket
hostPath:
path: /var/run/docker.sock
- name: proc
hostPath:
path: /proc
- name: utmp
hostPath:
path: /var/run/utmp
- name: config
configMap:
name: telegraf
Please note that this will use the same influxdb-creds secret definition to connect to our database. If all good, we should see our telegraf agent running:
xxxxxxxxxx
$ kubectl get pods -l name=telegraf
NAME READY STATUS RESTARTS AGE
telegraf-mrgrg 1/1 Running 0 18h
To check the log messages from the telegraf pod, simply execute kubectl logs <podname>. You should not see any error messages.
Set Up Grafana in Kubernetes
This will be the fun part. Finally, we should be able to see some of the data we collected (and remember, we will add everything). Grafana is a cool, full-featured data visualization for time-series datasets.
Let’s start with the usual username and password combo as a secret.
xxxxxxxxxx
kubectl create secret generic grafana-creds \
--from-literal=GF_SECURITY_ADMIN_USER=admin \
--from-literal=GF_SECURITY_ADMIN_PASSWORD=admin123
Add 1GB storage to store the dashboards:
xxxxxxxxxx
apiVersion: v1
kind: PersistentVolumeClaimmetadata:
name: graf-data-dir-pvcspec:
accessModes:
- ReadWriteOnce
resources:
requests:
storage: 1Gi
Define the deployment. As Grafana docker runs as 472 uid:gid, we have to mount the persistent volume with fsGroup: 472.
xxxxxxxxxx
apiVersion: apps/v1
kind: Deployment
metadata:
namespace: monitoring
labels:
app: grafana
name: grafana
spec:
replicas: 1
selector:
matchLabels:
app: grafana
template:
metadata:
labels:
app: grafana
spec:
containers:
- envFrom:
- secretRef:
name: grafana-creds
image: docker.io/grafana/grafana:7.3.3
name: grafana
volumeMounts:
- name: data-dir
mountPath: /var/lib/grafana/
securityContext:
fsGroup: 472 volumes:
- name: data-dir
persistentVolumeClaim:
claimName: graf-data-dir-pvc
Finally, let’s expose it in the same way we did with InfluxDB:
xxxxxxxxxx
apiVersion: v1
kind: Service
metadata:
annotations:
service.beta.kubernetes.io/aws-load-balancer-backend-protocol: http
service.beta.kubernetes.io/aws-load-balancer-ssl-cert: arn:aws:acm:eu-central-1:<account>:certificate/<certid> service.beta.kubernetes.io/aws-load-balancer-ssl-ports: "https"
labels:
app: grafana
name: grafana
namespace: monitoring
spec:
ports:
- port: 443
name: https
targetPort: 3000
selector:
app: grafana
type: LoadBalancer
Voila, we should have our Grafana up and running. Let’s check the ELB address with kubectl get services , point a nice hostname to its hostname/IP, and we are good to go. If all set, we should see something like: 
Use the username/password combination you defined earlier, and see the magic.

Home screen for our empty Grafana
Define Database Connection to InfluxDB
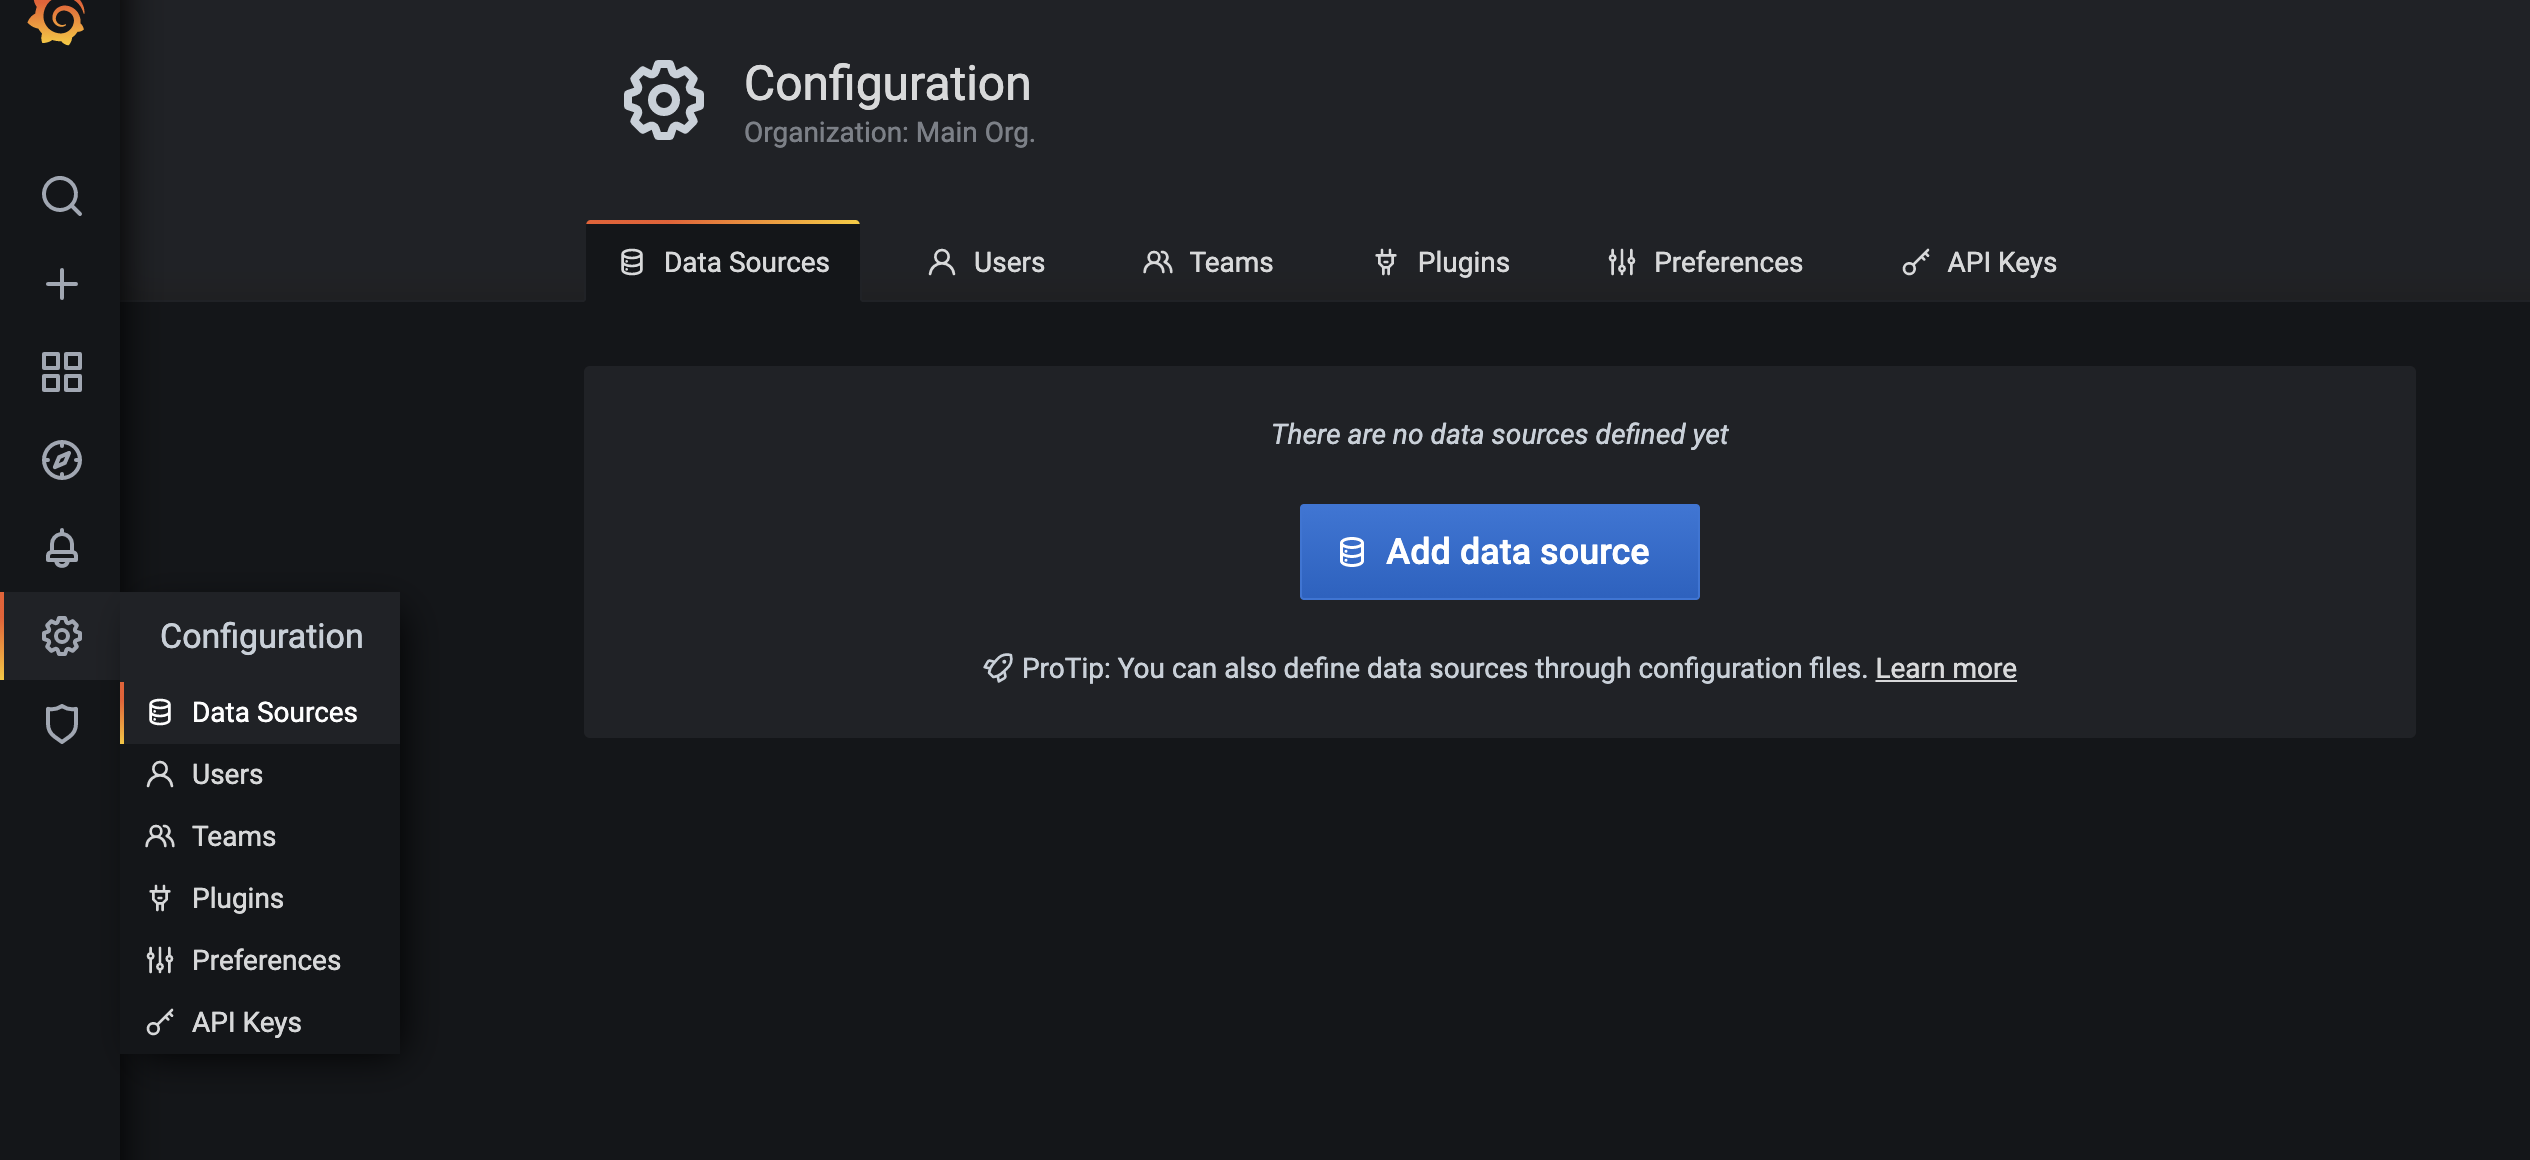
Why this can be done programatically, to keep this post short (it’s already way too long), let’s do it from the UI. Click on the gear icon, data source, Add data source:
Select InfluxDB:

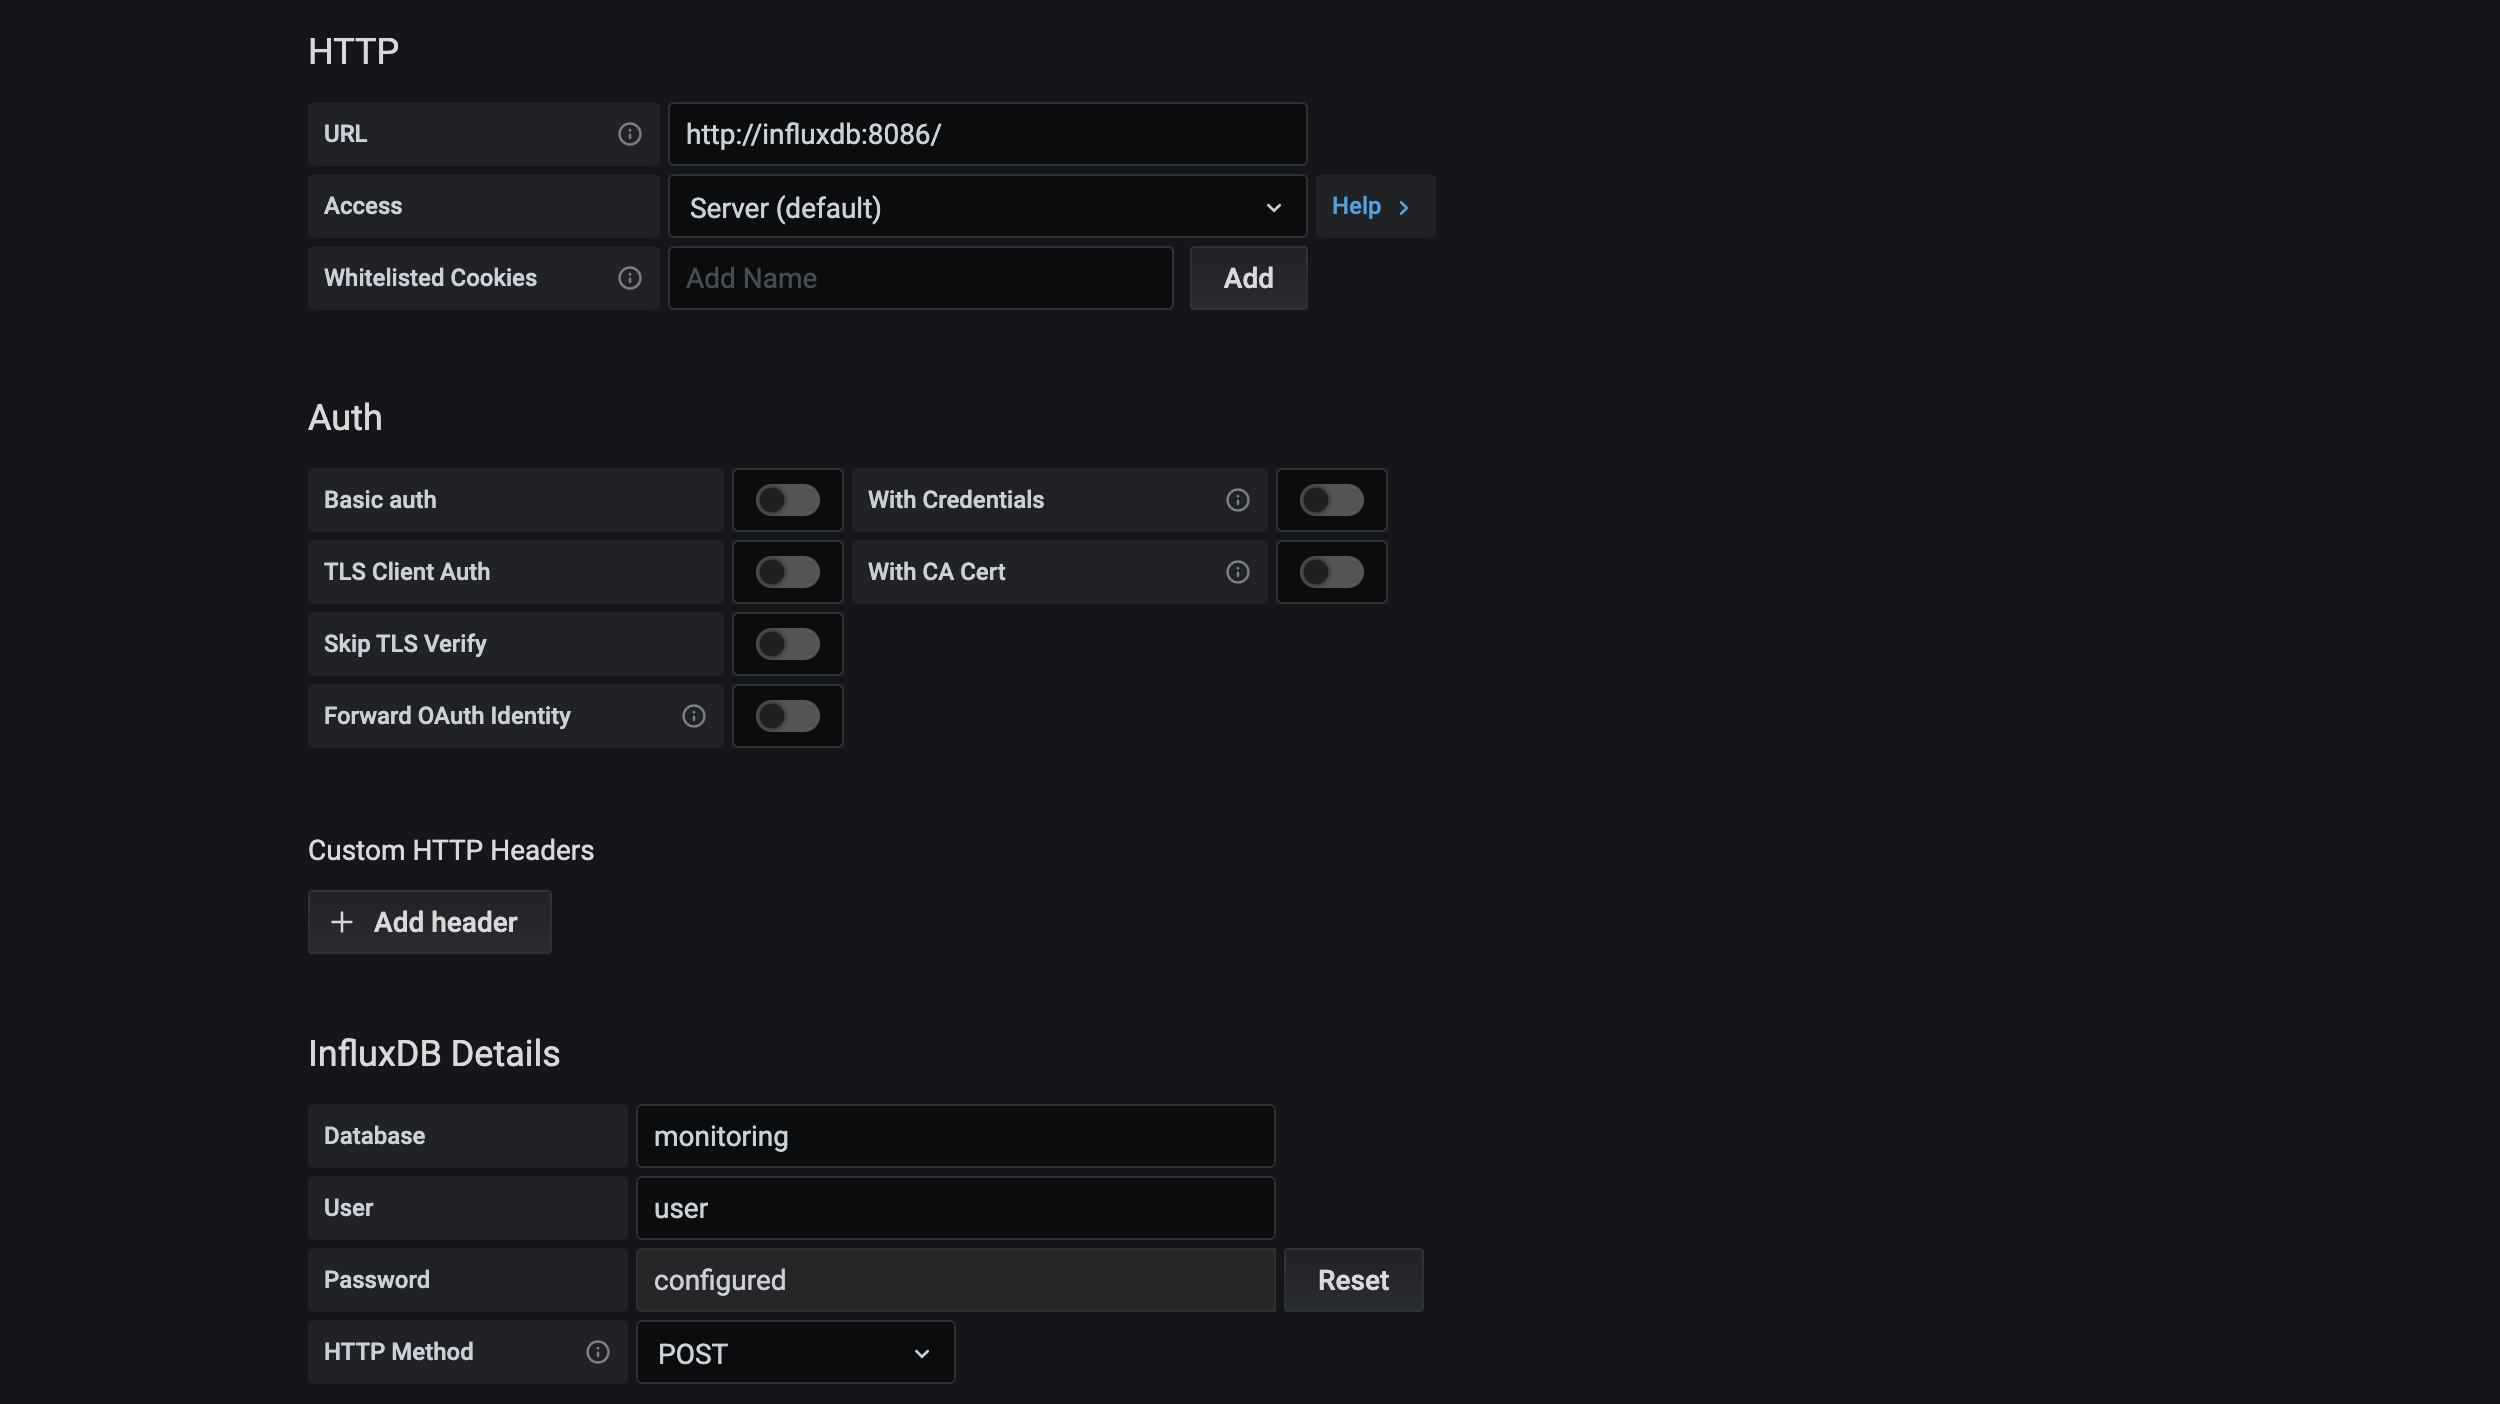
Add http://influxdb:8066/ as URL, and set up your user or readonly influxdb user.
Adding our First Grafana Dashboard
Our telegraf agent is loading some data, there is no reason to not look at it. We can import existing, community-built dashboards such as this one: https://grafana.com/grafana/dashboards/928.
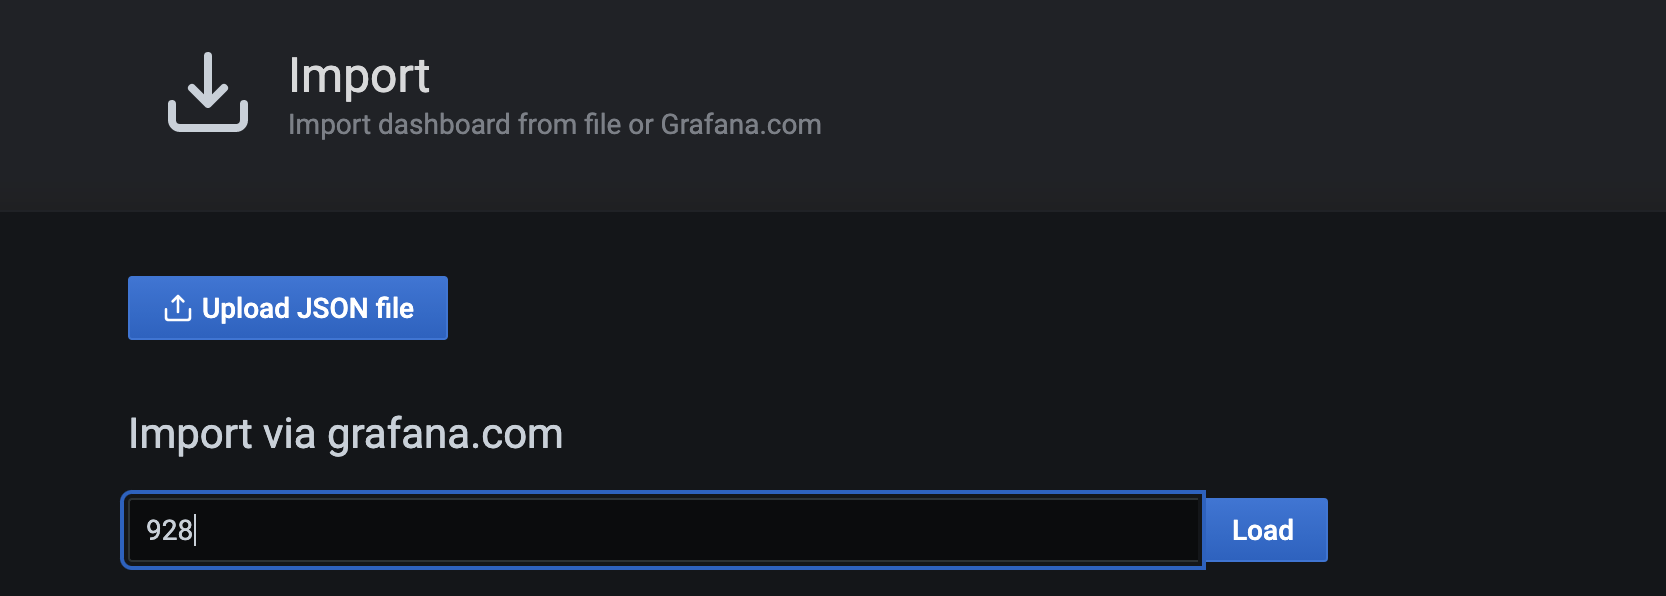
Click on the + sign on the side bar, then Import. In the import screen add the number of this dashboard (928).
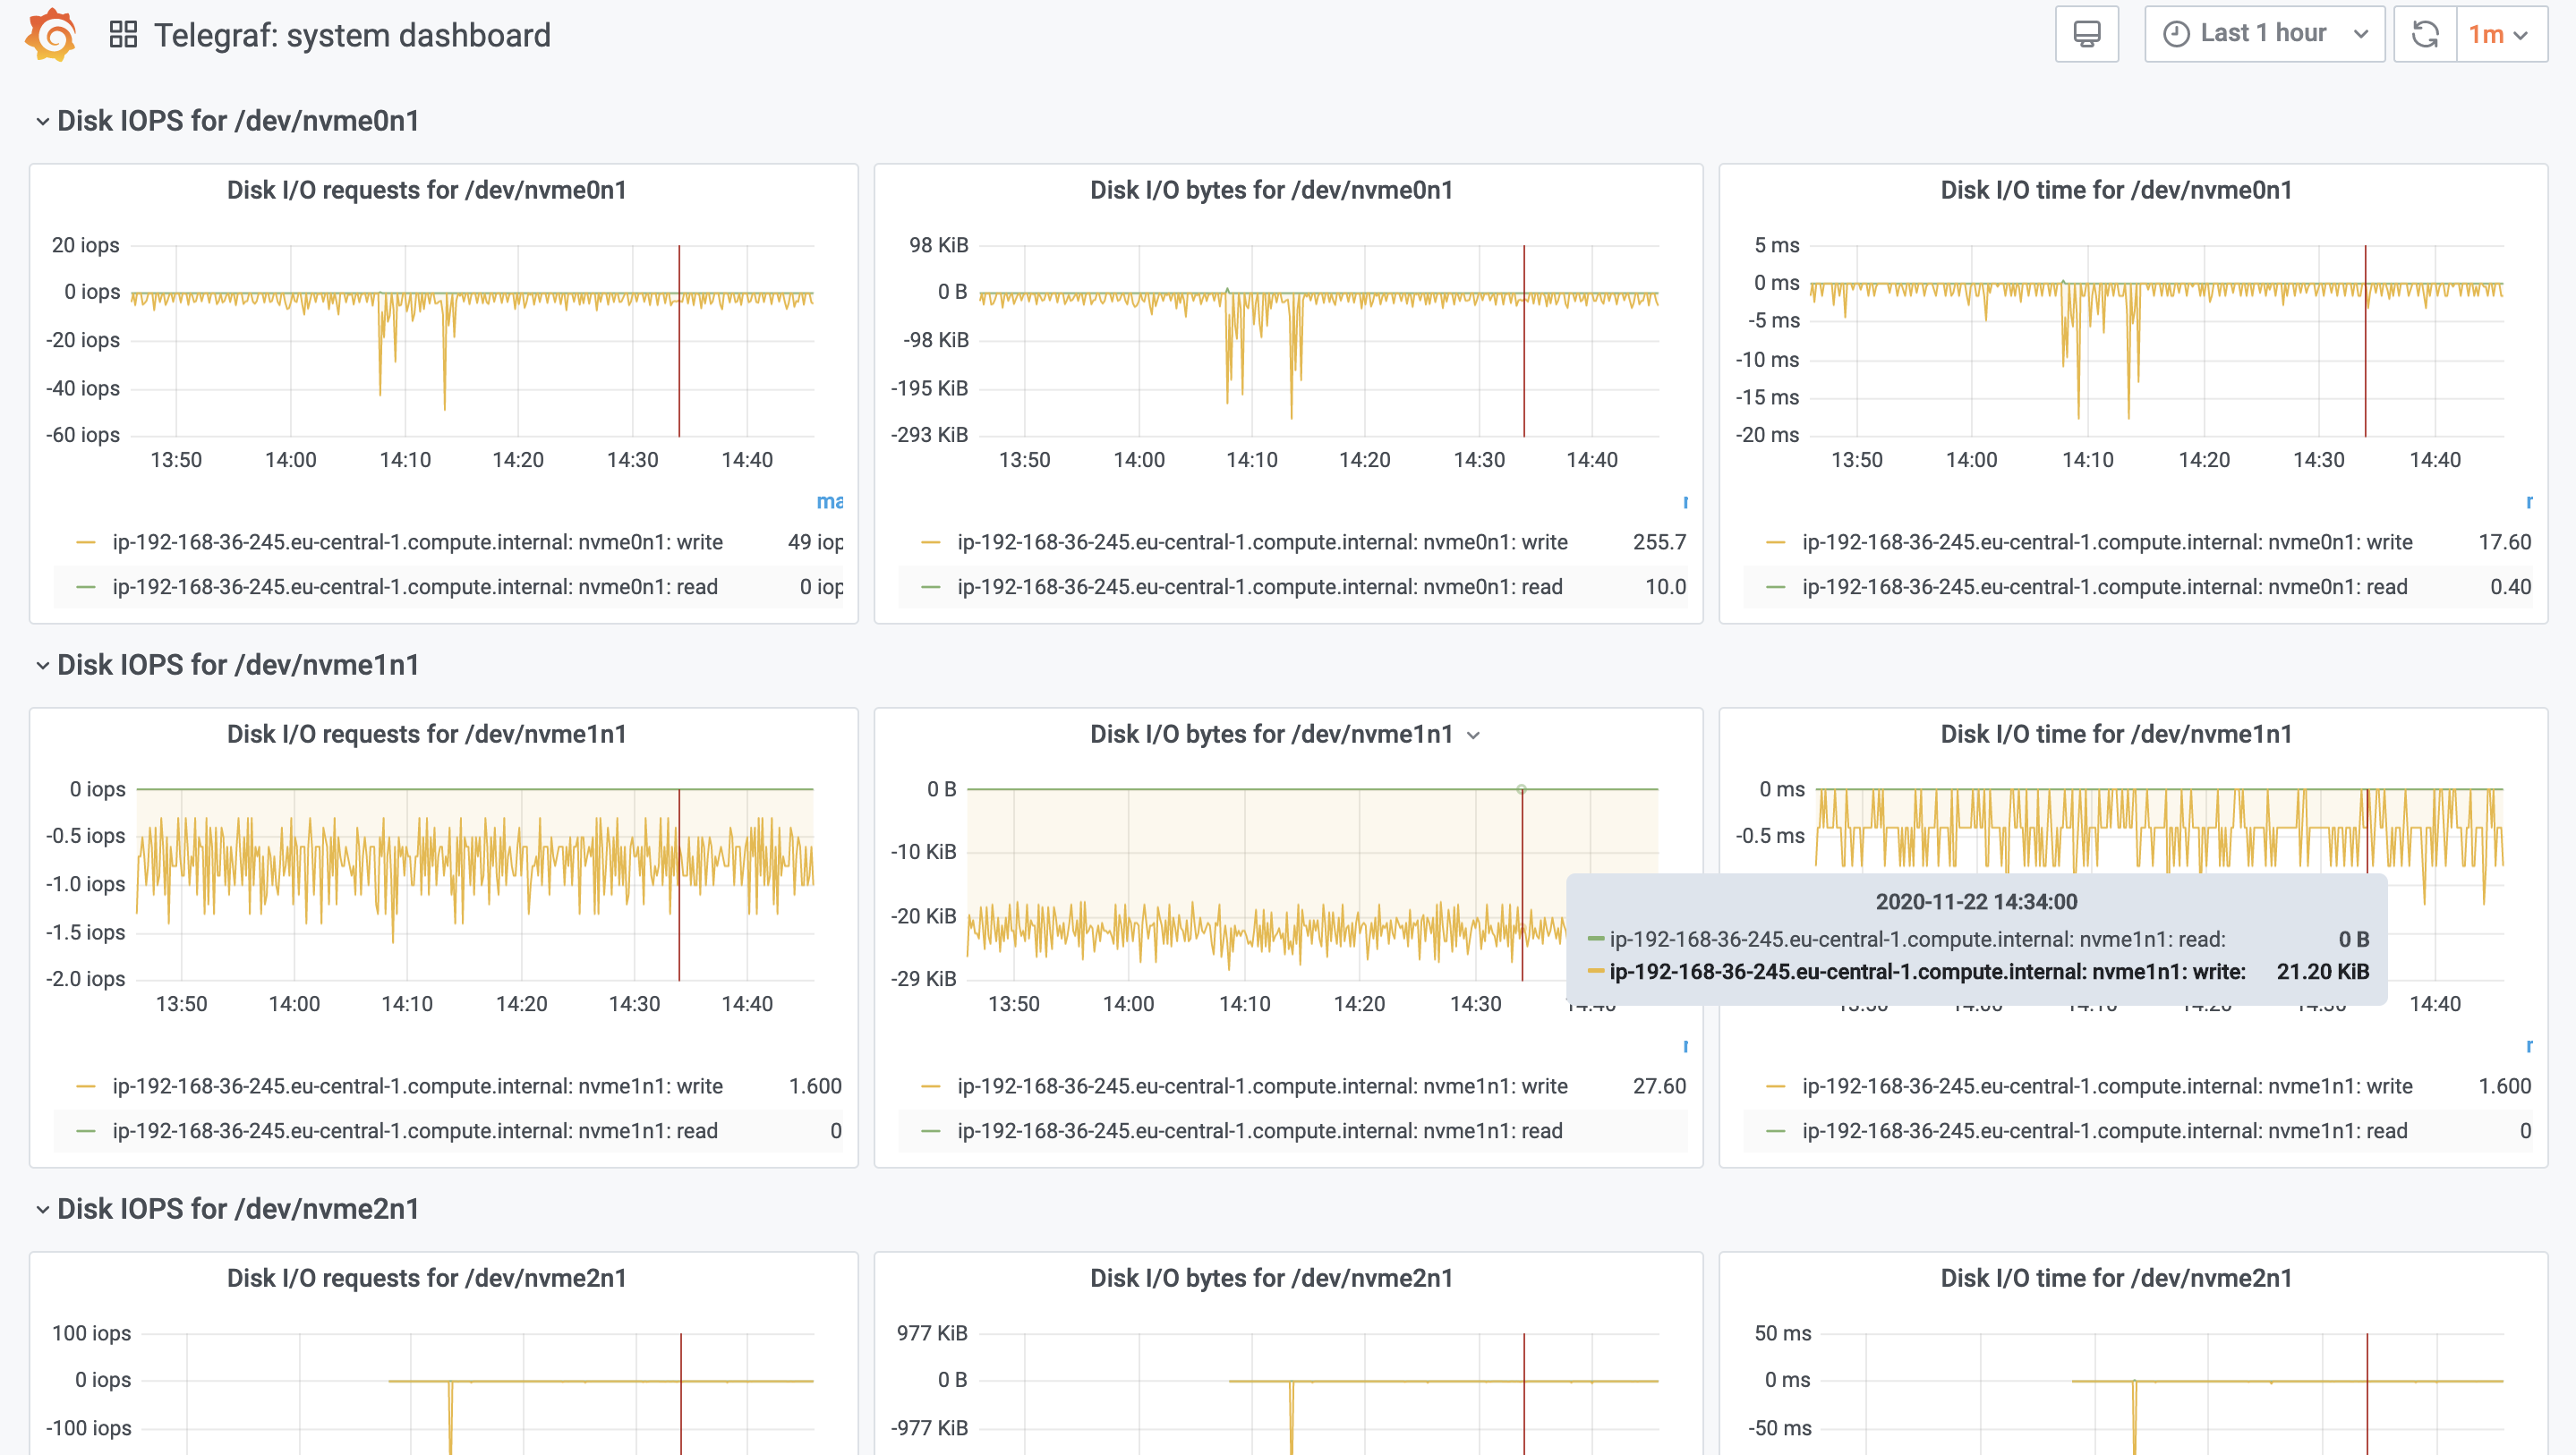
After importing, we should immediately see our previously collected data, in live: 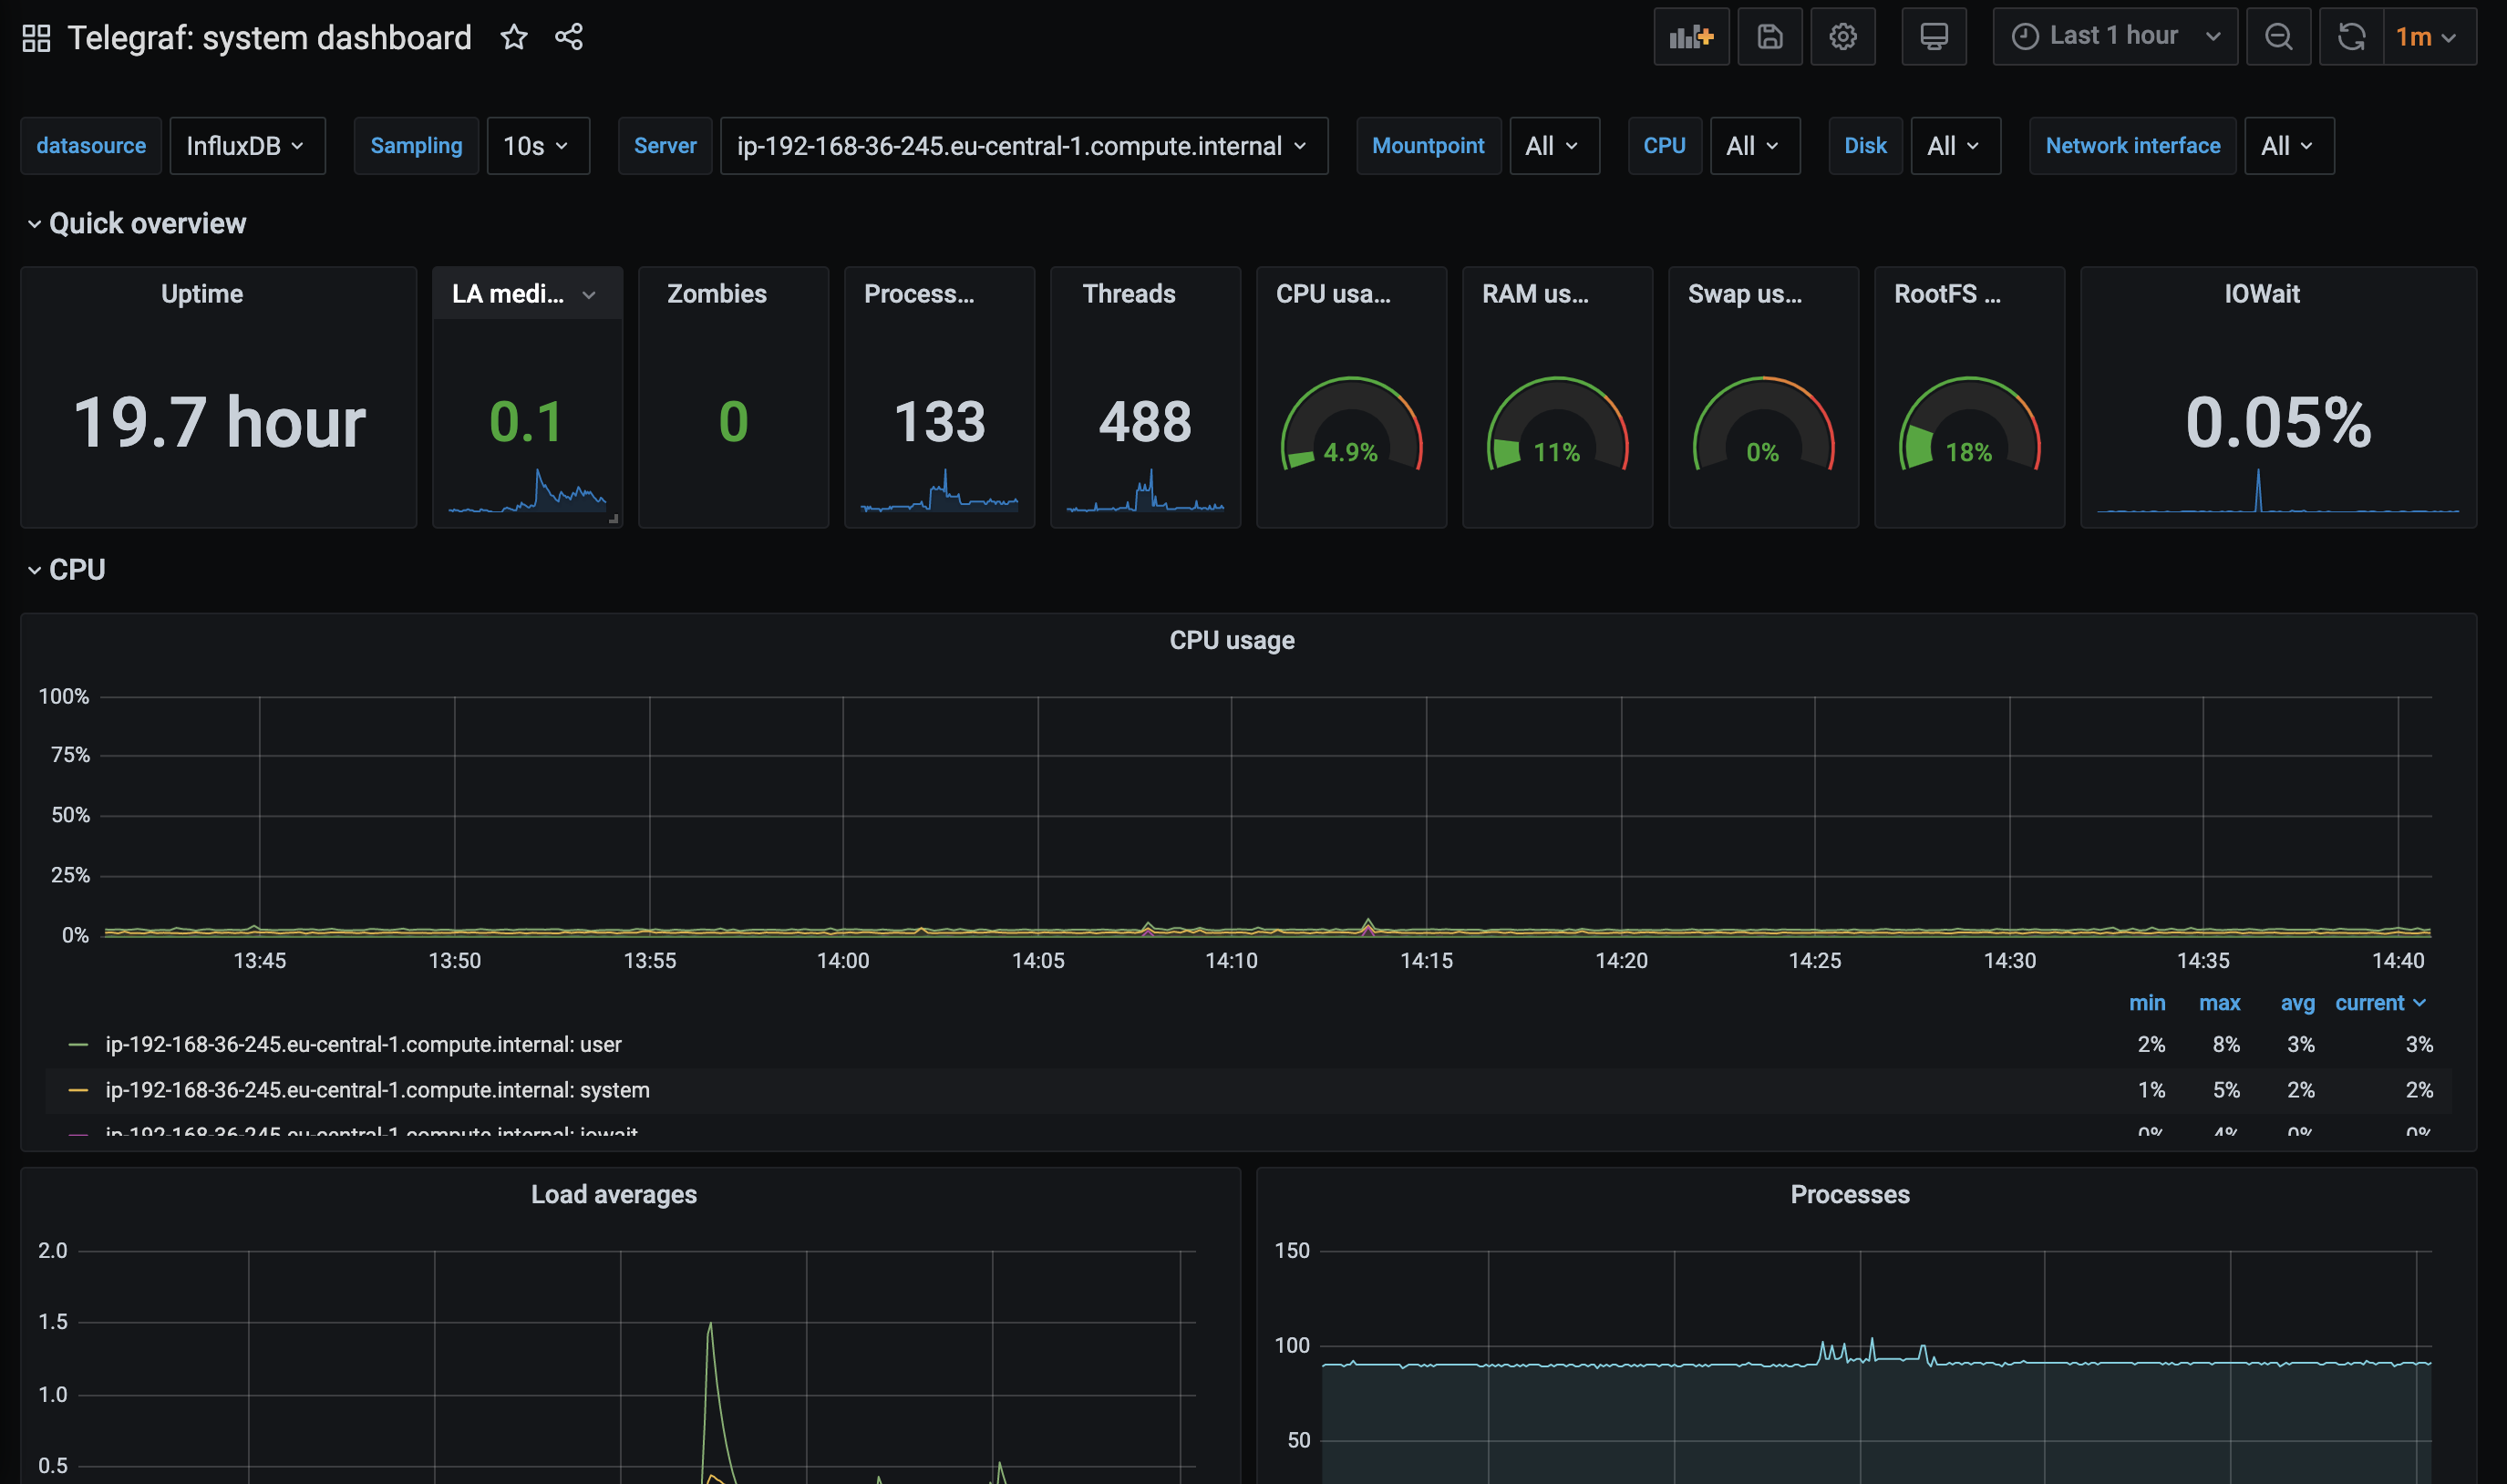
Feel free to start building your own dashboards, it is way easier than you think.
Next Steps
In the next blog, I will show how to monitor our (and our customers‘) Tableau Server and how to set up data-driven email/Slack alerts in no time.

