Setting Up Starlight For JMS to Send 1 Million Messages Per Second
Apache Pulsar™ is one of the most popular cloud-native messaging and streaming platforms with phenomenal usage by enterprises like Tencent, Comcast, and Verizon Media. When we launched the Pulsar client Starlight for JMS (S4J), which allows enterprises to run existing JMS applications on Pulsar, we made a bold claim: S4J can send one million messages per second with low latency.
In this post, we’ll show you exactly how we came up with that number and walk you through how to reproduce the results.
Where to Find Our Testing Framework
We used OpenMessaging Project, a Linux Foundation Collaborative Project, the same third-party benchmark framework we used for our Performance Comparison Between Apache Pulsar and Kafka: Latency.
The OpenMessaging Project provides vendor-neutral and language-independent standards for messaging and streaming technologies, with a performance testing framework that supports various messaging technologies.
You can find the test framework in the OpenMessaging benchmark GitHub repository. The tests are designed to run in public cloud providers. In our case, we ran all the tests in Amazon Web Services (AWS) using standard EC2 instances. We did extensive testing using AWS spot instances as well, which allows excess capacity to be used at a substantial discount.
We published the output from our final test runs as a GitHub gist. You’re welcome to analyze the data and come up with your own insights. You can also run the tests yourself and generate new data. You should get similar results.
How we Used the OpenMessaging Benchmark
The OpenMessaging benchmark is an open and extensible framework. To add a technology to test, you have to add a driver with configurations and an implementation of a Java library that controls the producers and consumers. We contributed a JMS driver harness, which when configured for Pulsar includes the Starlight for JMS Installation in the test harness.
We adjusted the Terraform configuration and Ansible playbook for Pulsar to support JMS testing, Spot Instances, and a larger cluster.
The tests begin with a warm-up period prior to measuring the results, and publish at a constant rate that you configure recording latency and throughput at regular intervals. This data is provided in a JSON file at the end of the test.
If you plan to run the tests yourself, know that running them in AWS is rather cheap. We used a significant number of EC2 instances. The cost of the cluster we used is almost $9 per hour or roughly $6,500 a month. AWS spot instances will halve the cost if they’re available. You’ll want to tear down the instance once you’ve completed your tests and copied the results.
Performance Considerations
We tested to find a configuration that would sustain production and consumption rates of one million messages per second, with the low publish latency and low end-to-end latency.
Let’s review what each of these terms mean:
Production rate is the number of messages written into a topic. We limited this rate to one million.
Consumption rate is the number of messages read out of the topic. We looked for this number to be very close to the production rate, which is one million.
Backlog is how many more messages have been produced minus the number of messages consumed. We worked to keep this as small as possible. High backlog values would result in high end-to-end latency.
Publish latency measures the time between sending the message and receiving acknowledgement. This is measured in nanoseconds and reported in milliseconds.
End-to-end latency measures the time between sending the message and reading it in the consumer. To ensure we’re measuring the complete end-to-end value, we use a message property. We verify that the client workers' clocks are synchronized using AWS’s free time sync services and that this value is measured in milliseconds.
Partitions are the number of broker connections for each topic’s producer and consumer. We looked for a number that would keep throughput reliable.
How Many Worker Nodes?
During testing, the worker nodes were observed with top -H and the number of clients was changed so that no java threads were CPU-bound. It turned out that we needed five producers and six consumers.
Setting up the Benchmark
We set up the benchmark tests by following the instructions documented in the OpenMessaging site, but altered for JMS. Note that because the OpenMessaging Benchmark evolves quickly, we’ve included a link to the exact commit used in our testing here.
You can alter the terraform.tfvars file adjusting num_instances as required. If you want to try Spot Instances, then alter provision-pulsar-aws.tf.
Next, apply the Terraform configuration and run the Ansible playbook. You should have the following EC2 instances:
driver-pulsar/deploy/terraform.tfvars

public_key_path = "~/.ssh/pulsar_aws.pub"

region          = "us-west-2"

ami             = "ami-9fa343e7" // RHEL-7.4


instance_types = {

  "pulsar"      = "i3.4xlarge"

  "zookeeper"   = "t3.small"

  "client"      = "c5.2xlarge"

  "prometheus"  = "t3.small"

}


num_instances = {

  "client"      = 11

  "pulsar"      = 4

  "zookeeper"   = 3

  "prometheus"  = 1

}
Figure 1. Terraform configuration.
Count |
EC2 instance |
Starlight for JMS |
4 |
13.4xlarge |
Pulsar Broker and Bookkeeper Bookie |
3 |
t3.small |
Zookeeper |
11 |
c5.2xlarge |
Benchmark workers - producers & consumers |
1 |
t3.small |
Prometheus/Grafana monitoring |
Table 1. EC2 instances produced.
Pulsar Nodes
The i3.4xlarge instance used for Pulsar/Bookkeeper is a powerful virtual machine with 16 vCPUs, 122 GiB memory, and two high-performance NVMe SSDs.
Calculating the Cost
Count |
EC2 instance |
Instance cost per hour |
Cluster cost per hour |
Spot saving |
|
Broker / Bookie |
4 |
13.4xlarge |
$1.28 |
$5.12 |
- 48% |
Zookeeper |
3 |
t3.small |
$0.0208 |
$0.0624 |
N/A |
Benchmark worker |
11 |
c5.2xlarge |
$0.34 |
$3.74 |
- 52% |
Prometheus |
1 |
t3.small |
$0.0208 |
$0.0208 |
N/A |
Cluster |
$8.9432 |
- $4.54 |
Table 2. EC2 instance and costs per hour.
Applying the Terraform configuration and running the Ansible playbook can take as long as 30 minutes. Here’s a gist showing how to modify the configuration to use lower-cost Spot Instances.
Workloads
The benchmark framework comes with a set of workloads that are YAML files. The ones that we created are in the GitHub repository.
Topics |
Partitions |
Message size |
Subscriptions |
Producer rate (msg/s) |
Consumer rate (msg/s) |
Duration |
10 |
3 |
100 Bytes |
1 |
1,000,000 |
1,000,000 |
2 hours |
Table 3. Workloads we used for our benchmark framework.
Some additional notes about our framework:
We used 10 topics to distribute the load throughout the cluster.
We found that three partitions gave the clients enough broker connections to avoid consumption delays. With only a single partition, consumption could slow and backlog build.
By setting producerRate to 1,000,000, production is divided between the producer workers. Then, a rate limiter keeps production at a nearly constant one million per second.
workloads/1m-10-topics-3-partitions-100b.yaml

name: 1m-10-topics-3-partitions-100b


topics: 10

partitionsPerTopic: 3

messageSize: 100

useRandomizedPayloads: true

randomBytesRatio: 0.5

randomizedPayloadPoolSize: 1000


subscriptionsPerTopic: 1

consumerPerSubscription: 1

producersPerTopic: 1


producerRate: 1000000


consumerBacklogSizeGB: 0

testDurationMinutes: 120
Figure 2. Workloads configuration on GitHub repository.
The Results Are In
Below, you’ll find three charts:
The consumption rate
The 99th percentile publishing latency for the duration of the test
The average end-to-end latency
Note that the percentile calculations for end-to-end latency have less precision than the publishing latency since the end-to-end measurements are millisecond precision, while the publishing measurements use nanosecond precision.
These tests used Apache Pulsar 2.8.1 and Datastax Starlight for JMS, an Apache Pulsar client for Fast JMS Messaging. All of the results are available in a gist.

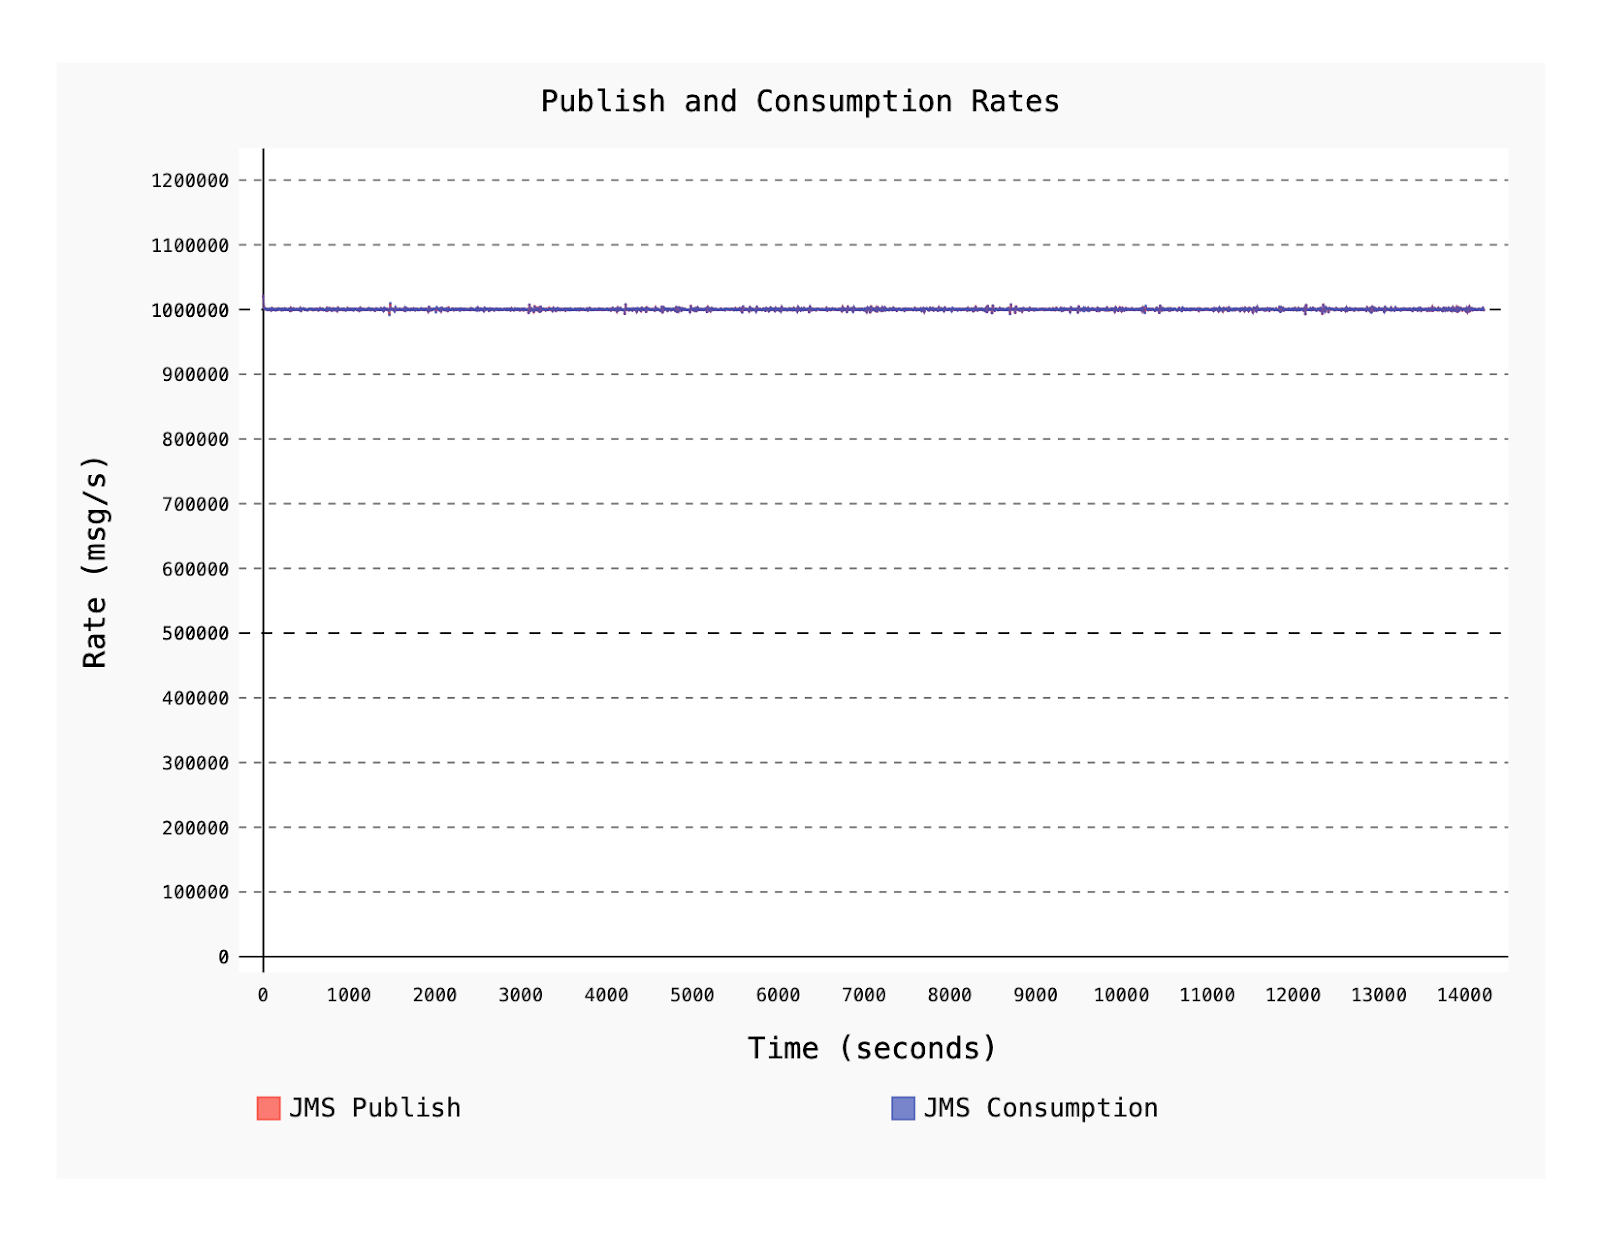
Figure 3. JMS Publish and Consumption rates.
Our goal of one million messages per second is achieved over a two hour duration. The rate was sustained on both the producer and consumer workers, on a modestly-sized Pulsar cluster.

Figure 4. The 99th percentile publishing latency in seconds.
Our claim of 99th percentile publishing latency under 10 milliseconds is also confirmed. Note that a larger Pulsar cluster will be able to achieve even lower latencies on the tail of the curve, because the more load you apply to fewer broker/bookies in the cluster, the more the pressure on the 99th percentile, moving the inflection point for the latency quantile to the left.

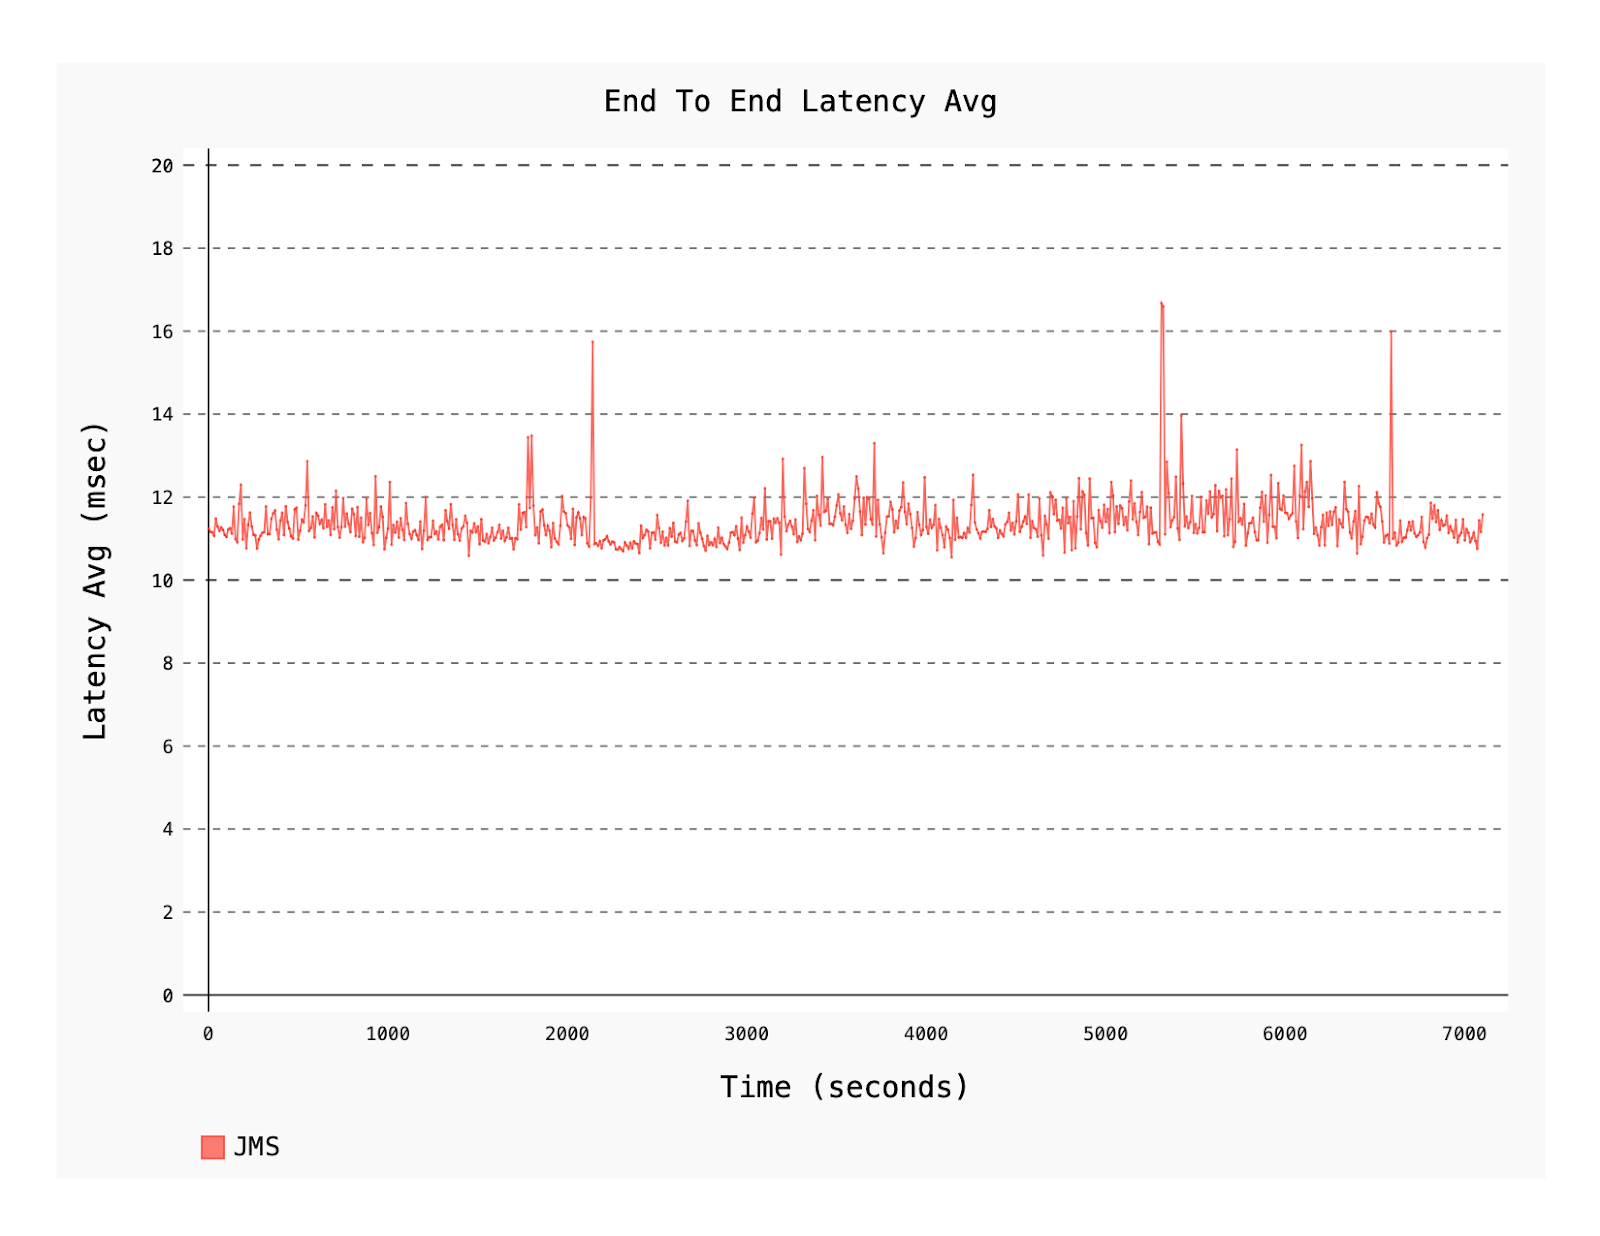
Figure 5. Average end-to-end latency measured over seconds.
Over 80% of the end-to-end latency is between 6 milliseconds and 14 milliseconds and is remarkably stable.
Lastly, we’ll show you a table that summarizes the latency distribution.
Latency type |
Average mean |
50% median |
75% |
95% |
99% |
Publishing (milliseconds) |
3.111 |
2,868 |
3.218 |
3.835 |
8.318 |
End-to-end (milliseconds) |
11.385 |
11.0 |
13.0 |
16.0 |
36.0 |
Table 4. A summary of latency distribution.
Conclusion
We’ve just shown, step by step, how we executed our messaging system testing framework, and how we confirmed the following results:
One million messages per second over a two hour duration, sustained on both the producer and consumer workers, on a modestly-sized Pulsar cluster
A 99th percentile publishing latency under 10 milliseconds. A larger Pulsar cluster will be able to achieve even lower latencies on the tail of the curve
Over 80% of the end-to-end latency is between six milliseconds and 14 milliseconds, and is remarkably stable
Unlike most traditional message brokers, Pulsar at its heart is a streaming platform designed for horizontal scalability. These tests illustrate what can be done with a modestly-sized Pulsar cluster. Growing the cluster by adding more broker and BookKeeper nodes means that we’re just scratching the surface of what can be achieved with Starlight for JMS.

