How to Debug Java Using a Decompiler
Decompiling Java code may not be something you do in daily development but it can help turn the tide when debugging critical problems. This is a beginners overview of how Java decompiling works to debug Java.
When I Need to Debug Java, How Does a Compiler Work?
When you build your project the compiler will take your Java source files (.java) and turn them into Java bytecode files (.class). These bytecode files can then be collected together and put into a single library (.jar) for you to share with other developers.
The bytecode files contain all the information you need to run your application. The JVM (Java Virtual Machine) reads these files and uses JIT (Just In Time) compilation to execute them at runtime. So what’s inside a Java bytecode file?

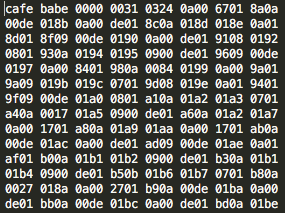
Raw Bytecode
Huh? That’s What I Wrote?
This is the intermediary interpretation of your source code. The bytecode files contain all the information to execute your source code; it can even include the original names of your classes and methods. At runtime the JVM will use class loaders to read the bytecode and turn them into specific machine code instructions.
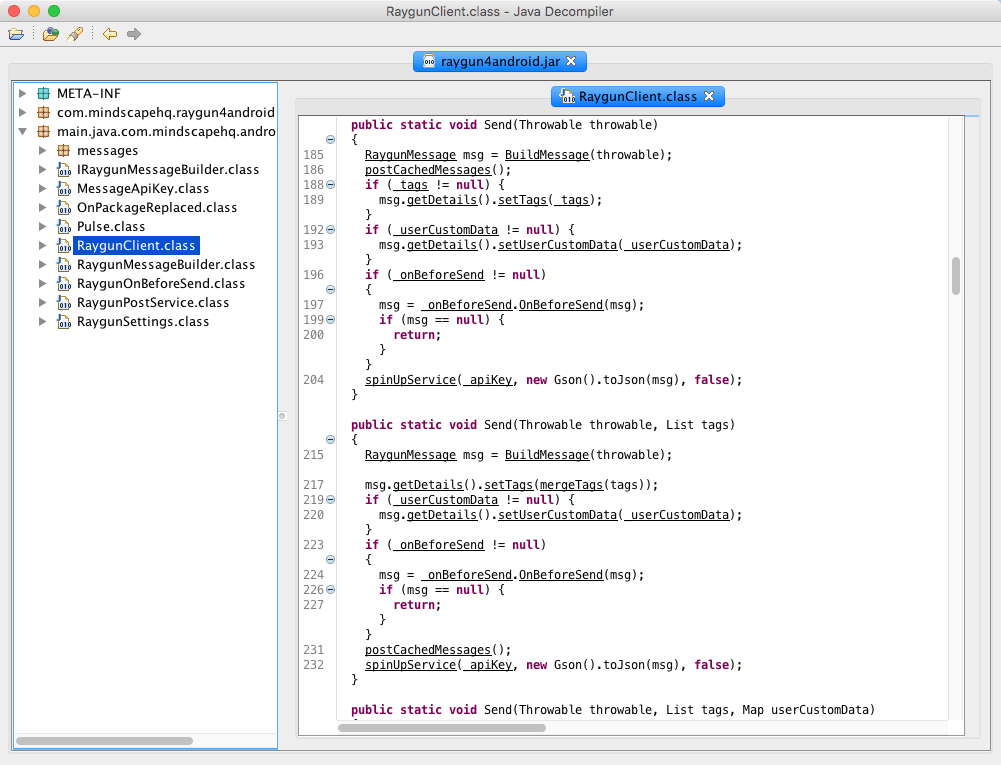
This is where decompilers come in! They take the same bytecode files and try to reconstruct it back into readable source code. There are a variety of tools out there but the one I am favouring currently is Java Decompiler. I finds it’s standalone application JD-GUI quite useful. Just dragging and dropping in Java libraries into the window will perform a decompile on the bytecode contained within.

Code shown inside the Java decompiler
This Seems Great! But What if I Don’t Want People to Know How My Source Code Works?
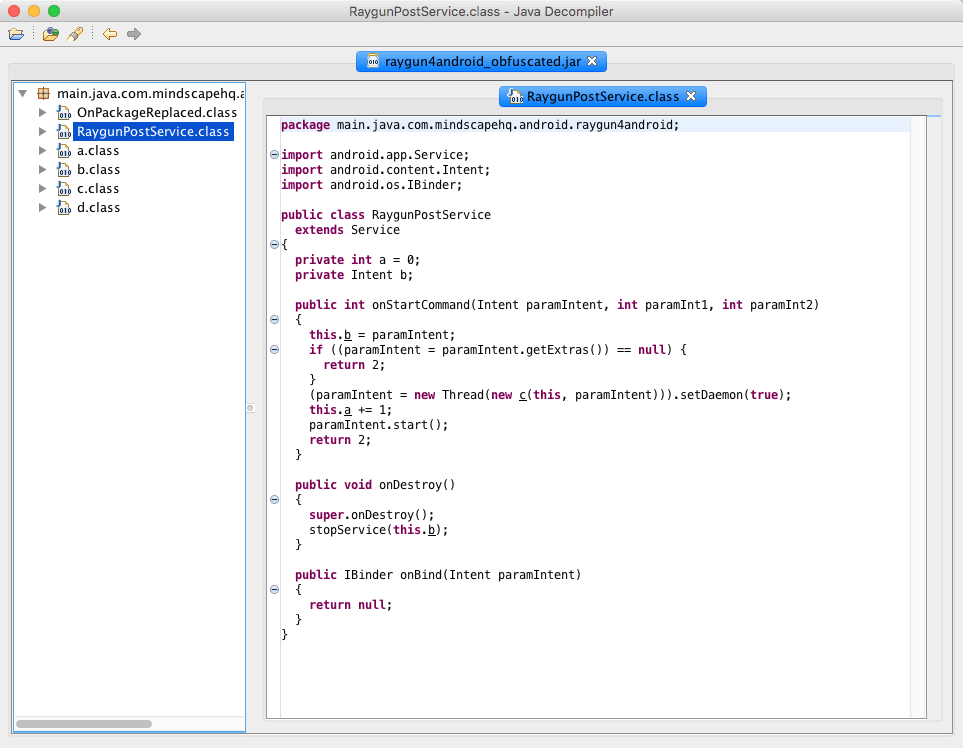
Well, you can’t stop people from decompiling the bytecode. But you can make it harder for them to interpret what it means. This is called obfuscation, and it takes the carefully thought out names in your source code and replaces them with generic identifiers. In most cases these will be alphabetical letters. This helps to hide some of the context in which your code would be used.

Example of obfuscated code inside the Java decompiler
An Exception Has Occurred!
Stack traces can also become hard to read if the crash happened in obfuscated code. When this happens it’s best to try and symbolicate the stack trace. This just means putting back the names that were taken out by the obfuscation process. If you choose to use ProGuard like I do these will be found in a file called mapping.txt (or in a .map file) in your build directory. Using this file you can put back some of the original names in the stack trace helping you to understand what actually broke.
Working on projects that rely on third party libraries means that occasionally you will run into someone else’s bugs that lead to an exception crashing your application. Options for debugging these problems let alone fixing them seems limited at first. However using a decompiler we can gather more information.
There are plugins that allow your IDE (like Eclipse) to use decompilers to step through decompiled code while debugging. This can help you to determine what is happening inside a third party library just before an exception occurs. JD-Eclipse is one such plugin you can use to do this.
“I’ma Let You Finish, But…”
This all leads to a more advanced topic called code injection. Code injection allows us to insert our own code into already compiled classes or methods during the build process or even at runtime. Let’s say you decompiled a third party library and managed to narrow down to the specific method that was crashing your application. You can then listen for when the JVM is going to execute that method and replace it with your own version that handles the exception safely.
It’s Just Not What I Ordered!
Decompilers become a useful tool when working on cross-platform projects. For example, a project once required me to rely on plugins written in C# (the project’s core language) to perform platform specific functionality in Java. Unfortunately some plugin providers just wouldn’t update their plugins for months at a time! If their product had a new feature or hot fix, I was dependent on their plugin to access it. The solution was to take their frequently updated core libraries (written in Java) and update the plugin myself or replace it entirely. Anytime there were changes I could simply decompile the latest library, find out which methods to call, and update the plugin wrapper accordingly.
Conclusion
Java decompilers are a great tool to have at the ready just in case you need to take your debugging further. They are a great way to debug Java. They provide you with options that you just don’t have when developing in other languages.
Give it a go and decompile the Java libraries you are using right now and let us know what you find in the comments below!

