How to Build a Treemap Using JavaScript
Treemap visualizations are widely used in hierarchical data analysis. If you need to build one but have never done that before, you might think the process is somewhat complicated. Well, not necessarily. I decided to make a step-by-step tutorial explaining how to create awesome interactive treemap charts with ease using JavaScript. And you’re gonna love the illustrations!
Are we alone in the universe? A question every one of us has asked ourselves at some point. While we are thinking about the odds of the Earth being the only habitable planet in the universe, or not, one of the things we might consider is how big the universe is. Let’s look at that with the help of treemaps! In this tutorial, we will be visualizing the scale of the 10 largest galaxies in the known universe using the treemapping technique.
So, would you like to know how to quickly build a JS-based treemap chart? Follow me in this stepwise tutorial and learn in an easy, fun way!
What Is a Treemap?
Before we get down to the tutorial itself, let’s look at the concept of treemaps. A treemap chart is a popular technique for visualizing hierarchically organized, tree-structured data. Designed to show at a glance the structure of hierarchy along with the value of individual data points, it makes use of nested rectangles whose size is proportional to the corresponding quantities.
Each branch of the tree is a rectangle, and for sub-branches, there are smaller rectangles nested inside them. Displaying data by color and proximity, treemaps can easily represent lots of data while making efficient use of space and are great for comparing proportions within hierarchies.
The treemap chart type was invented by professor Ben Shneiderman who has given significant contributions in the field of information design and human-computer interaction. Treemaps are used in many data visualization areas and can be found applied in the analysis of stock market data, census systems, and election statistics, as well as in data journalism, hard drive exploration tools, etc.
A Peek at Our JS Treemap Chart
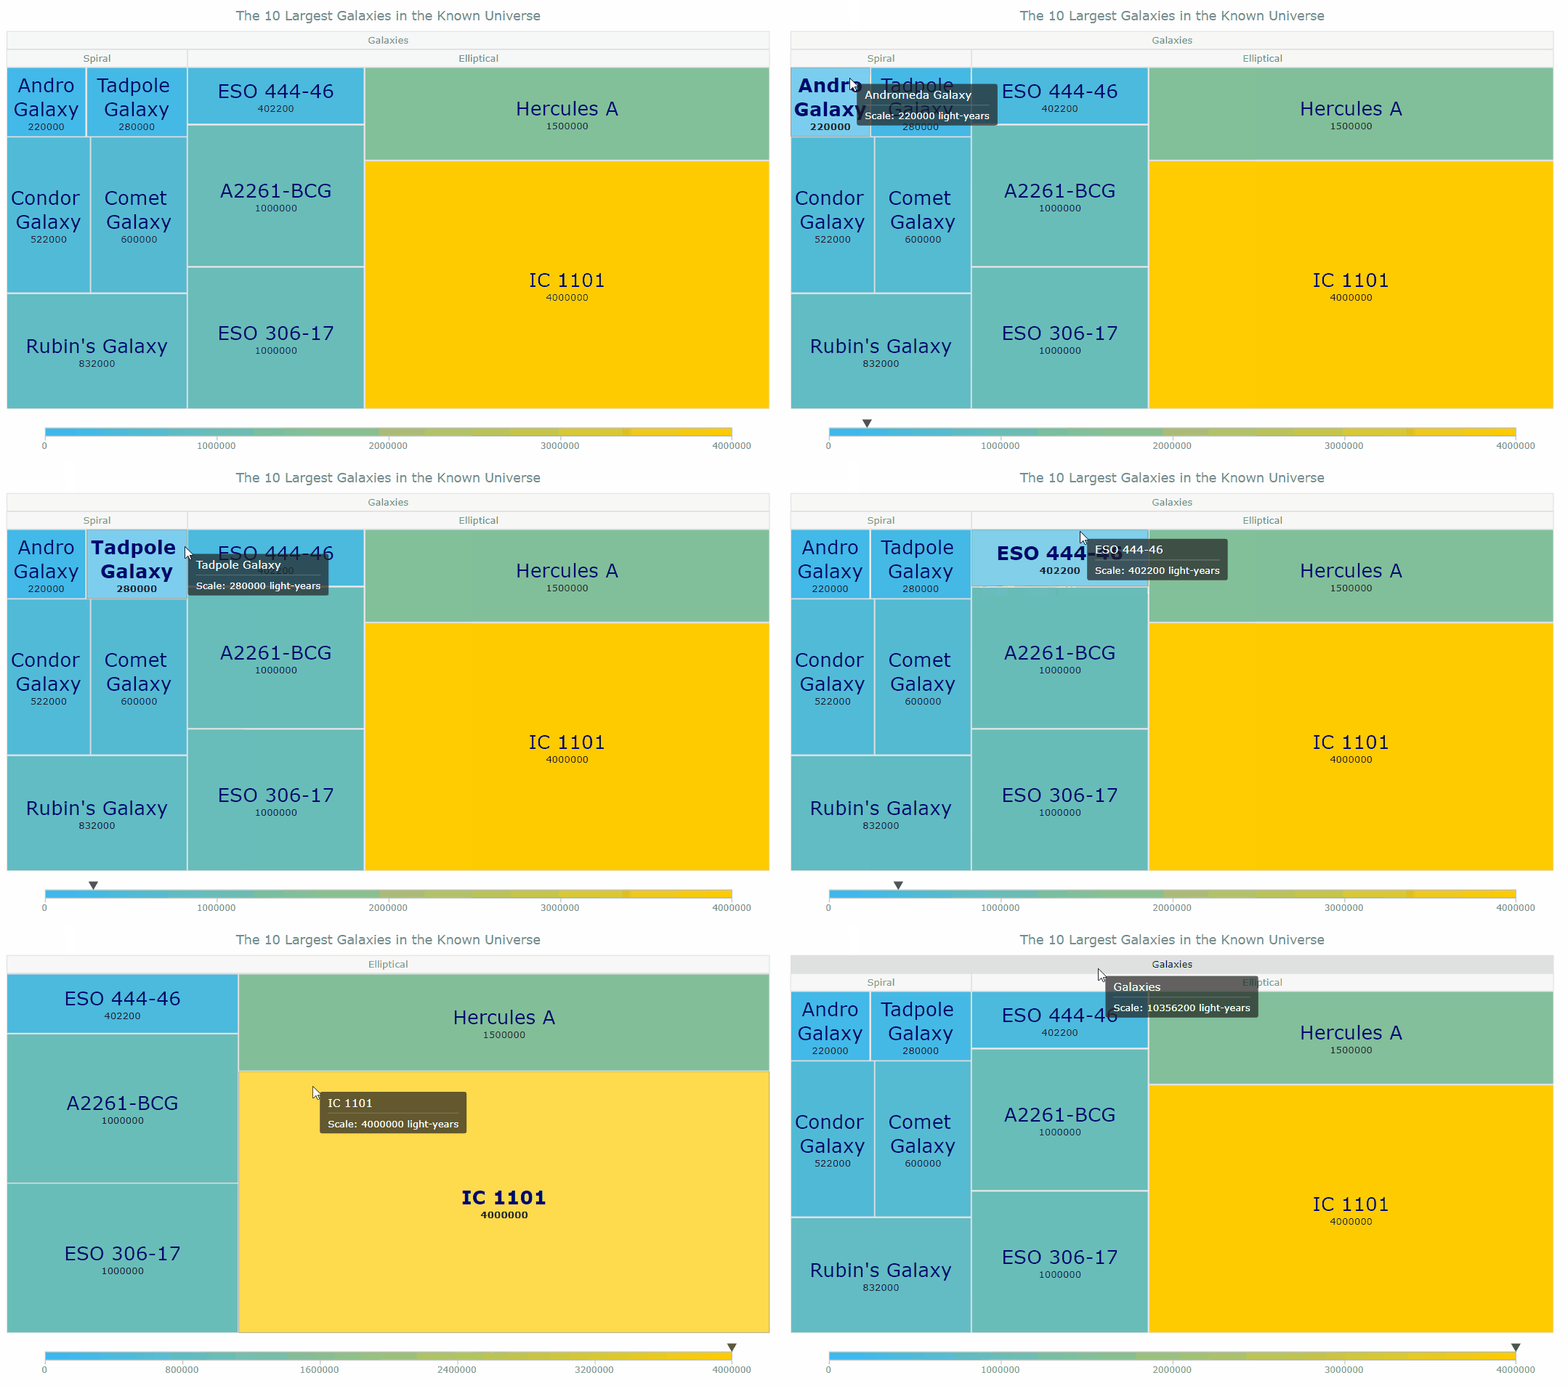
So now, we will build a treemap using JavaScript to compare the sizes of the top 10 galaxies in the known universe. Take a look at exactly what we are going to create. This is what our JS treemap chart will look like by the end of the tutorial.

Let’s start our interstellar journey!
Create a Basic JS Treemap Chart
Creating a JavaScript-based treemap chart generally takes four basic steps that are as follows:
Create an HTML page
Reference JavaScript files
Set data
Write some JS treemapping code
And don’t worry if you are a novice in HTML, CSS, and JavaScript. We will go through each and every step in detail, and by the end of this tutorial, you will have your own JS treemap ready.
So, the countdown has begun, let’s get our chart ready for launch.
1. Create an HTML Page
The first thing we do here is to create a basic HTML page. There, we add an HTML block element (<div>) — that’s where our treemap chart will be placed — and assign it an ID attribute (for example, let it be “container”) to reference it later in the code.
We should also set some styling for the <div>. Let’s define the width and height properties as 100% and margin and padding as 0. You may change this to your liking.
