How to Deploy a Startup Script to an Integration Server Running in an IBM Cloud Pak for Integration Environment
In a Cloud Pak for Integration (CP4I) environment, the IBM App Connect operator does a good job monitoring the Integration Server pods and will restart any pods where the Integration Server fails. Either in the rare event that it has crashed or because it is no longer responsive to liveness checks. It is worth noting that by far the most common reason for an Integration Server pod to fail in one of these ways is because it has insufficient resources to process its workload however there are some cases where the user may wish to initiate a restart in response to some other external criteria.
In this example, we will consider the case where user supplied Java code in a Java Compute Node has caused an OutOfMemory error. In this instance, the error would not ordinarily be fatal to the Integration Server; however, a user may wish to restart the Integration Server on receiving an error of this type. The same approach can be generalized to any error condition which can be detected in a file on the IS container internal file system. We also assume that the target environment is a Cloud Pak for Integration instance; however, the same approach can be applied to any IBM App Connect Enterprise Operator installation including on plain Kubernetes. Indeed, some of the elements we discuss in this article can be further generalized to traditional on-premise environments.
Overall Approach
The approach we will take here has the following steps:
- A background script will monitor a file or set of files looking for specific error text.
- When the text is matched, the script will kill the parent process of the IntegrationServer.
- The OpenShift system will notice that the pod has failed and start a new instance of this pod.
The Monitor Script
Let's take a look at the script we will be using:
echo "Starting monitor script"nohup tail -n0 -F $1/log/*events* | awk '/OutOfMemoryError/ { system("echo \"Detected Error, restarting pod\"") system("kill 1") }' 2>$1/log/monitor.out 1> $1/log/monitor.err &echo "Script started"
This script starts off by writing a message that it is about to start. This is useful as it allows us to also confirm in the IntegrationServer stdout that the monitoring script is actually installed.
The next line initiates a background process. The nohup command along with the "&" at the end of this line of the script means that the next set of commands will be run as a background process and will not terminate when the parent shell terminates. This is important, as we need to return control to the Integration Server after the script is launched. It should also be noted that it is necessary to redirect the stdout and stderr of the background process to ensure that the script as a whole continues executing and returns control to the Integration Server. Without the redirection when the script completes, it attempts to close the stdout/stderr stream of the child process, but this can't be done because the command we are running (tail) will never actually complete.
Now let's consider what we are actually doing inside the background process. Specifically, this inner portion of the 2nd line:
tail -n0 -F $1/log/*events* | awk '/OutOfMemoryError/ { system("echo \"Detected Error, restartingpod\"") system("kill 1") }'
In a CP4I environment, a copy of all BIP messages is written to the "Event Log" which is located in /home/aceuser/ace-server/log. These files have names of the form integration_server.test-oom.events.txt.X where X is either a number or empty. Each time the IS restarts it will "roll over" onto a new log file and similarly if one of these log files reaches its size limit a new one will be created. Once the maximum number of log files is reached the IS will start writing to the first log file. Since this means that the log files may not all exist at startup and over time, they may be rolled over we need to use the -F flag for tail in order to ensure that if the filedescriptor changes as a result of the log file rolling over or a new log file being created tail will still pickup changes.
The other thing to note about the tail command is that it is set to -n0 so that it does not print any context on initial execution and will instead simply output all new lines added to the monitored file after the initial execution of the tail command. This is important because if the monitored files are either in the work dir (like the log files) or on a persistent volume then they may survive a pod restart. So, in order to prevent the same log lines being re-processed when a pod restarts we need to make sure only new lines are output by tail.
The next part of the command is a simple awk script. This script contains a regex that matches the error text we want to use as a trigger condition. In this case, we want to capture any message that contains the string "OutOfMemoryError". If the line output by tail matches, then the awk script will write a message to the stdout of the background process (which will be redirected to the /home/aceuser/ace-server/log/monitor.out file) and then issues a kill command against pid 1.
In a CP4I environment, pid 1 will always be the runaceserver process and killing this process will cause the OpenShift platform to recognize that the pod has failed and restart the pod.
Deploying the Monitoring Script
So now we have our monitoring script, we need to actually configure the Integration Server to execute it during IS startup. To do this, we can deploy it to the CP4I environment using a "generic" configuration. To do this, we first need to place the script in a zip file and then obtain the contents of the zip file as a base64 encoded string. For example:
davicrig:run$ zip monitor.zip monitor.shadding: monitor.sh (deflated 30%)davicrig:run$ base64 -w 0 monitor.zipUEsDBBQAAAAIAHli81aGdruxqwAAAPUAAAAKABwAbW9uaXRvci5zaFVUCQAD1sa3ZNbGt2R1eAsAAQToAwAABOgDAABdj70OgkAQhHueYnIx/hAV8QGo1M5Q2NoQWPUC3JK9RULUd9fgT2E1yWRmv52mKwLKL4xR/FZz0EzUujNqdlZZ4HOxjZrA8aVtoJmtsHArLHavTlTxOQrpSk59iDuyrsQkSltNT3uqWfqtCEuEG3zvleqpGSBHsyGlXKkAhsQcEPJfcsPF0ZjZr1PaqkL8Mh4TYJ18sJ//ltwq4gR/Lolg/J00LMBwnwoTPAFQSwECHgMUAAAACAB5YvNWhna7sasAAAD1AAAACgAYAAAAAAABAAAA/4EAAAAAbW9uaXRvci5zaFVUBQAD1sa3ZHV4CwABBOgDAAAE6AMAAFBLBQYAAAAAAQABAFAAAADvAAAAAAA=
The long base64 encoded string can be copied to the clipboard. Once the contents of the zip file has been copied, we need to create a new configuration from the IBM App Connect operator using the following settings:

When this configuration is made available to the Integration Server, it will unzip the provided zip file into the /home/aceuser/generic directory:
/home/aceuser/genericsh-4.4$ lsmonitor.sh
Customizing an Integration Server to Run the Monitoring Script
So the next step is to actually instruct the Integration Server to run the script during startup. To do this, we can use the server.conf.yaml "StartupScripts" stanza.
StartupScripts:
  FirstScript:
    command: /home/aceuser/generic/monitor.sh ${WORK_DIR}
    directErrorToCommandOutput: false
    includeCommandOutputInLogs: true
    stopServerOnError: true
There are a few important things to note about the settings here. In the "command" property we list the fully qualified script name, but we also pass in the ${WORK_DIR} token. This is a special token that is dynamically replaced with the Integration Server's work directory at runtime. For a CP4I environment we could have used a fully qualified path however in traditional on premise deployments we need to use this token in preference to the MQSI_WORKPATH environment variable to cope with cases where a stand-alone Integration Server has its work directory located in a different location to MQSI_WORKPATH.
It is also important to note that we must have directErrorToCommandOutput set to false. Setting this value to true prevents the script from exiting properly and causes the startup script to hang which means that the Integration Server is never passed back control and never properly starts.
So, once we have our configured server.conf.yaml snippet we need to create a configuration to make this available to the IntegrationServer on the CP4I environment. We can do this by creating a Configuration of the "serverconf" type:

Here the "Data" field in the form should contain the server.conf.yaml snippet we are changing encoded into base64.
Creating a Test Flow
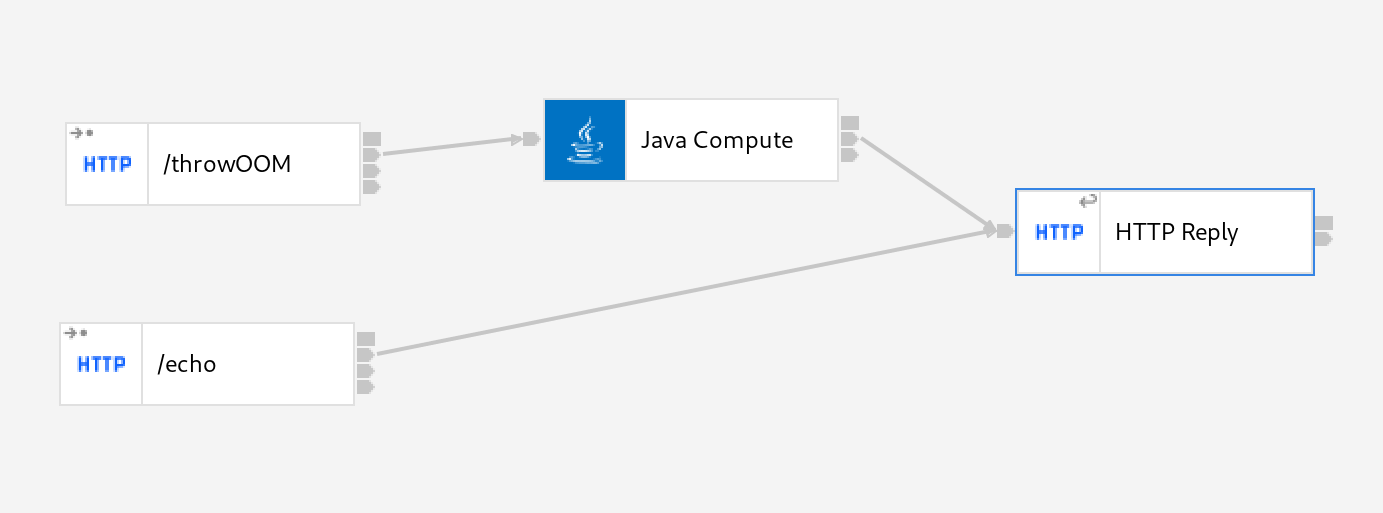
We are almost ready to configure the Integration Server itself, but first of all, we need to create an application which will actually simulate our error condition so that we can demonstrate the monitor script in action. To do this, simply create the following flow in the App Connect Enterprise Toolkit:

Here we have 2 HTTP Input nodes, one which will simply immediately issue a successful reply and a second which will execute a Java Compute Node. The Java Compute Node will deliberately throw an error in order to simulate a real failure:
// ----------------------------------------------------------
// Add user code below
if(true) {
throw new OutOfMemoryError("oh no! out of memory");
}
// End of user code
// ----------------------------------------------------------
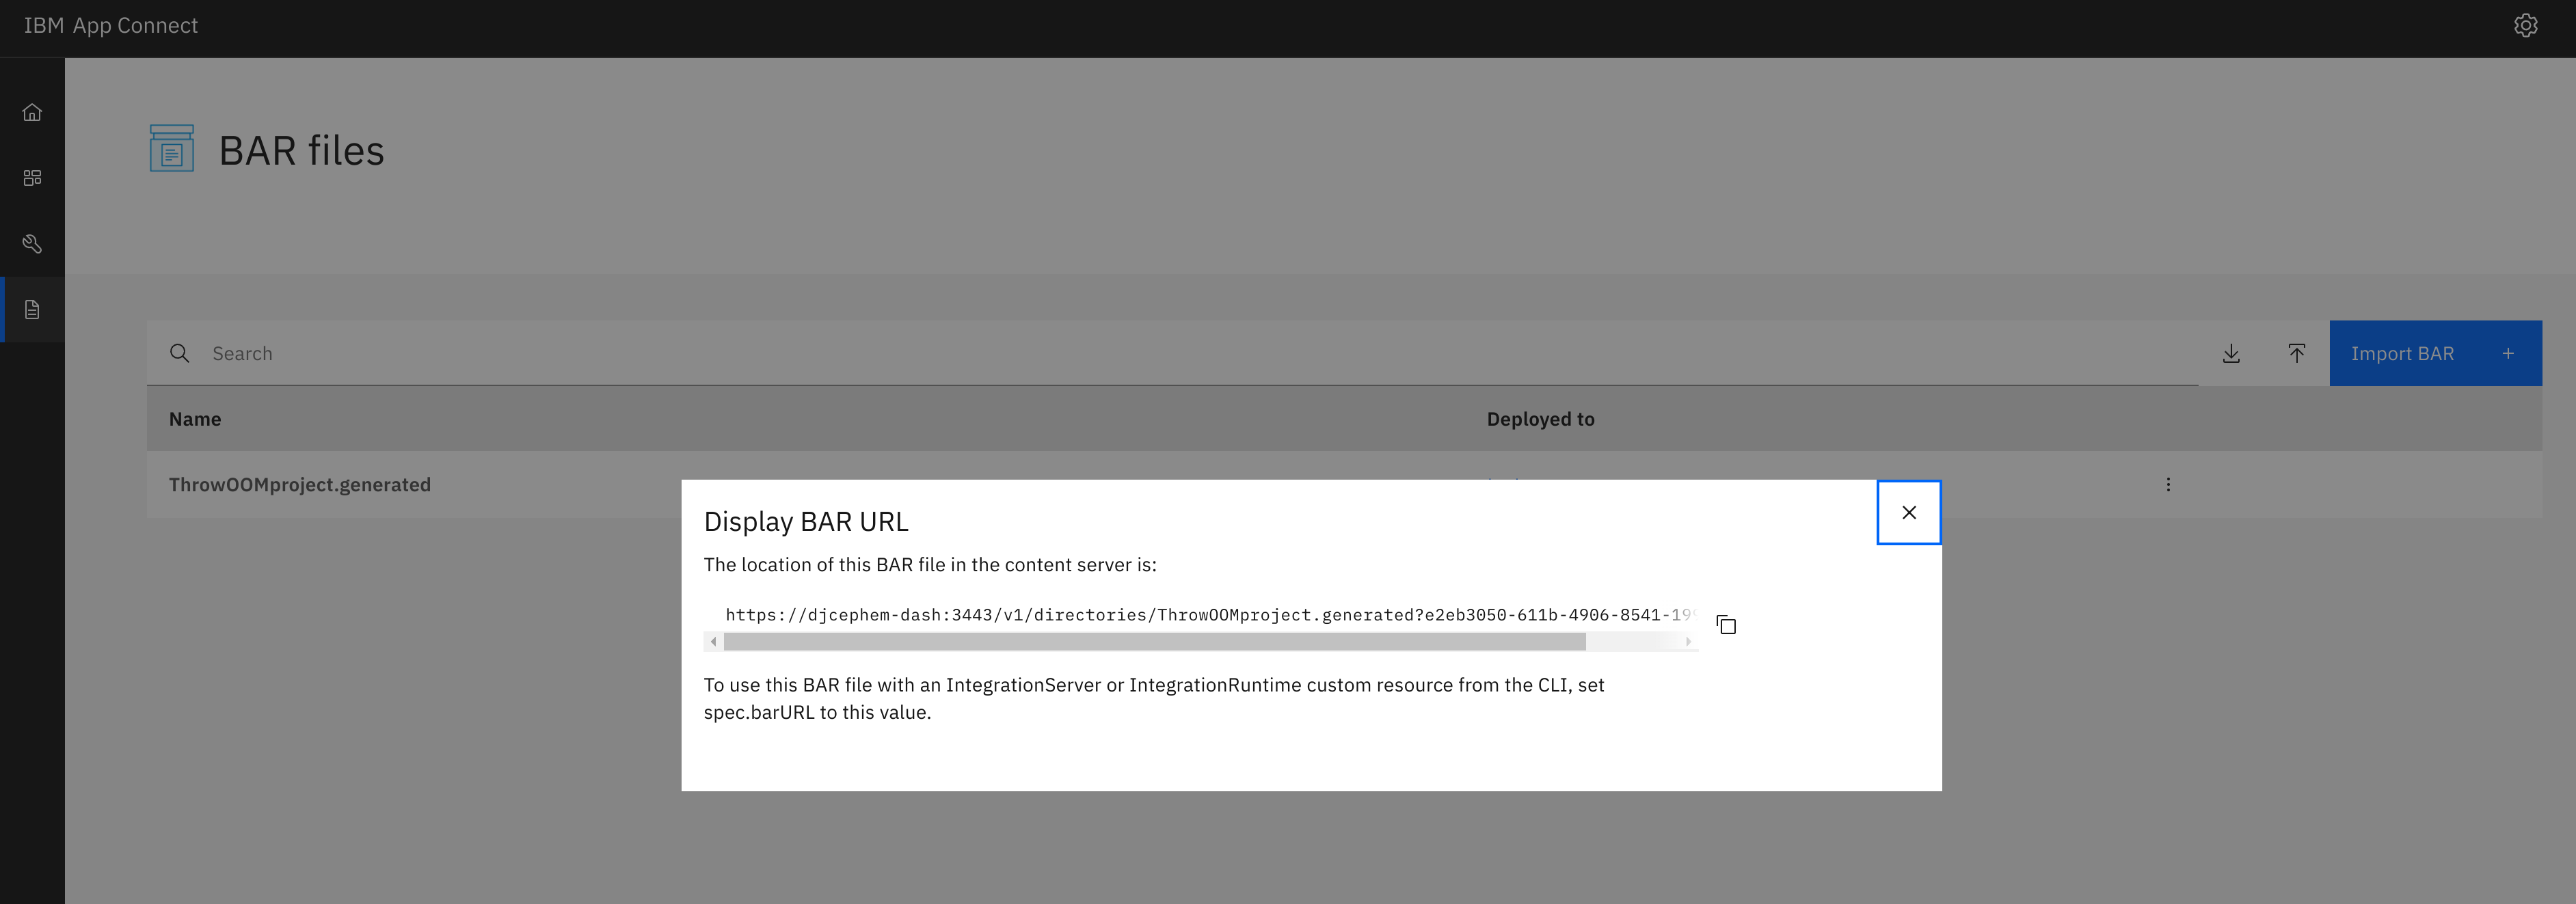
In order to make this available to the Integration Server, we must deploy this to a dashboard server and obtain the barfileURI as shown below:

Making the Deployed Configurations Available to an Integration Server
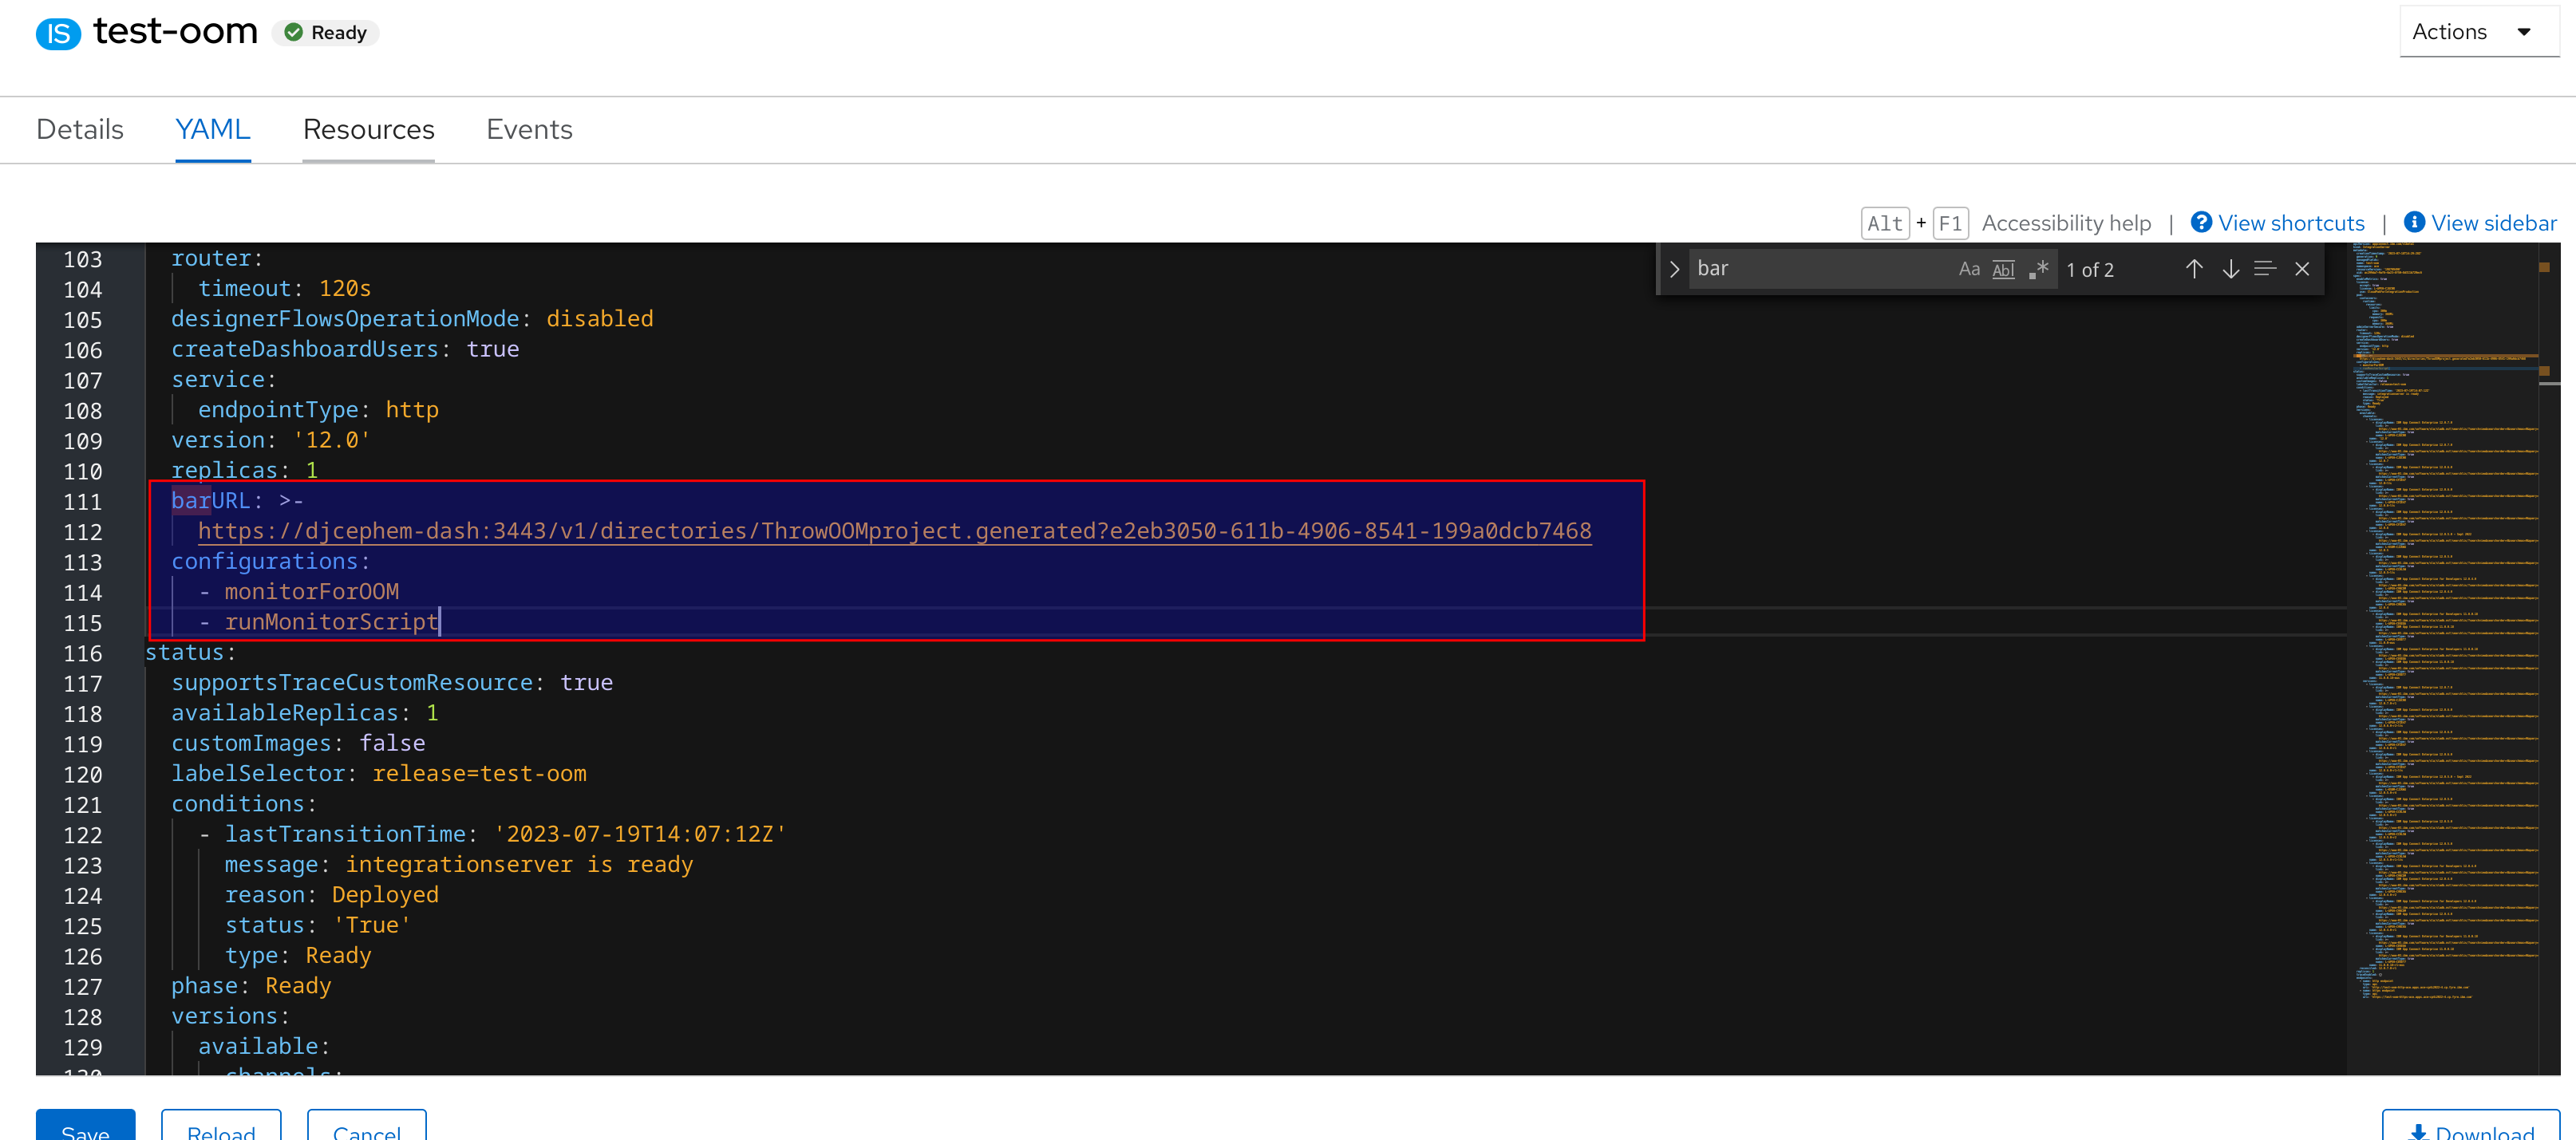
Now we are ready to configure an Integration Server to use the newly uploaded BAR file and the 2 custom configurations that we created earlier. This example assumes that we will be modifying an existing Integration Server however it is also possible to create a new Integration Server by following the same process. We make the deployed configurations available to the Integration Server by updating the "spec" section of the Integration Server yaml as shown below:

When you hit the save button, the Operator will reconcile the changes and create a new pod with the Configurations deployed. If we examine the logs for the Integration Server, we can verify that the startup script has executed:
2023-07-19 13:48:39.418412: BIP1990I: Integration server 'test-oom' starting initialization; version '12.0.7.0' (64-bit)
2023-07-19 13:48:39.418960: BIP9560I: Script 'FirstScript' is about to run using command '/home/aceuser/generic/monitor.sh /home/aceuser/ace-server'.
Starting monitor script
Script started
2023-07-19 13:48:39.424804: BIP9565I: Script 'FirstScript' has run successfully.
2023-07-19 13:48:39.518768: BIP9905I: Initializing resource managers.
Testing the Solution
We can test our script by issuing a curl command against the test flow that we just deployed:
sh-4.4$ curl -v http://localhost:7800/throwOOM
*   Trying ::1...
* TCP_NODELAY set
* connect to ::1 port 7800 failed: Connection refused
*   Trying 127.0.0.1...
* TCP_NODELAY set
* Connected to localhost (127.0.0.1) port 7800 (#0)
> GET /throwOOM HTTP/1.1
> Host: localhost:7800
> User-Agent: curl/7.61.1
> Accept: */*
>
command terminated with non-zero exit code: exit status 137The terminal connection has closed.
Here the terminal closes because as soon as the runaceserver process is killed OpenShift will terminate and restart the pod. The pod logs for the pod will show the following:
2023-07-19T14:25:00.122Z Signal received: terminated
2023-07-19T14:25:00.124Z Stopping metrics gathering
2023-07-19T14:25:00.125Z Stopping Integration Server
2023-07-19 14:25:00.127057: BIP1989I: Integration server is terminating due to a shutdown event.
If we log back in to the terminal once the pod is restarted we can examine the previous entries in the events file and confirm that a message matching our error filter was received:
sh-4.4$ cat integration_server.test-oom.events.txt.1 | grep Out
2023-07-19 14:25:00.114267Z: [Thread 202] (Msg 3/4) BIP4367E: The method 'evaluate' in Java node 'Java Compute' has thrown the following exception: java.lang.OutOfMemoryError: oh no! out of memory.
2023-07-19 14:25:00.114306Z: [Thread 202] (Msg 4/4) BIP4395E: Java exception: 'java.lang.OutOfMemoryError'; thrown from class name: 'ThrowOOM_JavaCompute', method name: 'evaluate', file: 'ThrowOOM_JavaCompute.java', line: '24'
Extending to Other Actions
Restarting the pod is not the only action we can take based on a trigger from a monitoring script. We can also execute arbitrary App Connect Enterprise Administration REST API commands. The following script used in place of the original example for instance will enable service trace when the trigger condition is met:
echo "Starting monitor script" nohup tail -n0 -F $1/log/*events* | awk '/OutOfMemoryError/ { system("echo \"Detected Error,enabling trace\"") system("curl --unix-socket /home/aceuser/ace-server/config/IntegrationServer.uds -X POST http://localhost:7600/apiv2/start-service-trace") }' 2>$1/log/monitor.out 1> $1/log/monitor.err & echo "Script started"
Note that here we are using the unix domain socket interface to the web admin API rather than the tcp interface. This is the same interface used by mqsi* commands and relies on operating system user security. It is possible to use the normal admin port running on port 7600 to make a standard REST request, however it is not possible to extract the basic auth credentials from the script itself since the script runs as aceuser and the credentials are owned by the root user (for security reasons). Therefore instead of passing the basic auth credential into the script where they would be available in plaintext to aceuser I have opted instead to use the unix domains socket.
If instead of the original monitor.sh we deploy this new update copy, we can see that when the test flow is executed the pod logs will show that trace is enabled:
2023-07-19 21:08:33.037476: BIP2297I: Integration Server service trace has been enabled due to user-initiated action.Similarly, from within the pod we can confirm that trace files have been created:
sh-4.4$ find ace-server/ -name *trace*
ace-server/config/common/log/integration_server.test-oom.trace.0.txt
sh-4.4$ ls -la ace-server/config/common/log/integration_server.test-oom.trace.0.txt
-rw-r-----. 1 1000660000 1000660000 21852199 Jul 19 21:13 ace-server/config/common/log/integration_server.test-oom.trace.0.txt
Conclusion
In this article, we have seen how to deploy a startup script to an Integration Server running in a CP4I environment and use this to monitor the error logs in order to take corrective action to restart the pods or to run arbitrary admin commands using the REST interface. Using a monitor script provides a great deal of flexibility for reacting to specific conditions for both recovery and troubleshooting purposes.

