Open-Source Kafka Tooling

As a messaging platform, Kafka needs no introduction. Since its inception, it has virtually rewritten the book on event streaming and catalyzed the adoption of the now household design patterns — microservices, event-sourcing, and CQRS.
Being such a godsend, it almost gets away with its notorious lack of tooling. You'd be hard-pressed to find a developer who hasn't at one time looked at the built-in CLI tools, cupped their face and uttered: "Is this it? Are you kidding me?"
You may also like: Apache Kafka With Scala Tutorial
What's Out There?
With the popularity of Kafka, it's no surprise that several commercial vendors have jumped on the opportunity to monetize Kafka's lack of tooling by offering their own. Kafka Tool, Landoop, and KaDeck are some examples, but they're all for personal use only, unless you're willing to pay. (And it's not to say that you shouldn't, but that's rather beside the point.) Any non-trivial use in a commercial setting would be a violation of their licensing terms. It's one thing using them at home for tutorials or personal projects; when you're using a commercial tool without the appropriate license, you are putting your employer at risk of litigation and playing Russian Roulette with your career.
But what about open source?
When it comes to Kafka topic viewers and web UIs, the go-to open-source tool is Kafdrop. With 800K Docker pulls at the time of writing, I don't believe there are many other Kafka tools that have enjoyed this level of adoption. Kafdrop lets you view topic contents, browse consumer groups, view consumer lag, topic configuration, broker stats, and more. All in all, it does an amazing job of filling the apparent gaps in the observability tooling of Kafka, solving problems that the community has been pointing out for too long.
Kafdrop is an Apache 2.0 licensed project, like Apache Kafka itself. So it's won't cost you a penny. If you haven't used it yet, you probably ought to. So let's take a deeper look.
Getting Started
The Kafdrop web UI project is hosted on GitHub.
There's a couple of options at your disposal. You could show a little bravery by cloning the repository and building from source. It's a Java (JDK 11) Spring Boot project, and you can build it with a single Maven command, providing you have the JDK installed. If you want to go down this path, the repo's README.md file will guide you through the steps. For now, let's take the easy way — Docker. (I sure would.)
Docker images are hosted on DockerHub. Images are tagged with the Kafdrop release number. The latest tag points to the latest stable release.
To launch the container in the background, run the following command:
docker run -it --rm -p 9000:9000 \
-e KAFKA_BROKERCONNECT=<host:port,host:port> \
obsidiandynamics/kafdrop
The KAFKA_BROKERCONNECT environment variable must be set to the bootstrap list of brokers.
That's it. We should be up and running. Once it starts, you can launch the Kafka web UI by navigating to localhost:9000.
Note: The above example assumes an authenticated connection over a plaintext TCP socket. If your cluster is configured to use authentication and/or transport-level encryption, consult the
README.mdfor connection options. It's actually surprisingly easy to configure Kafdrop for a SASL/SSL locked-down cluster.
Navigating the Kafka Web UI
Browsing the Cluster
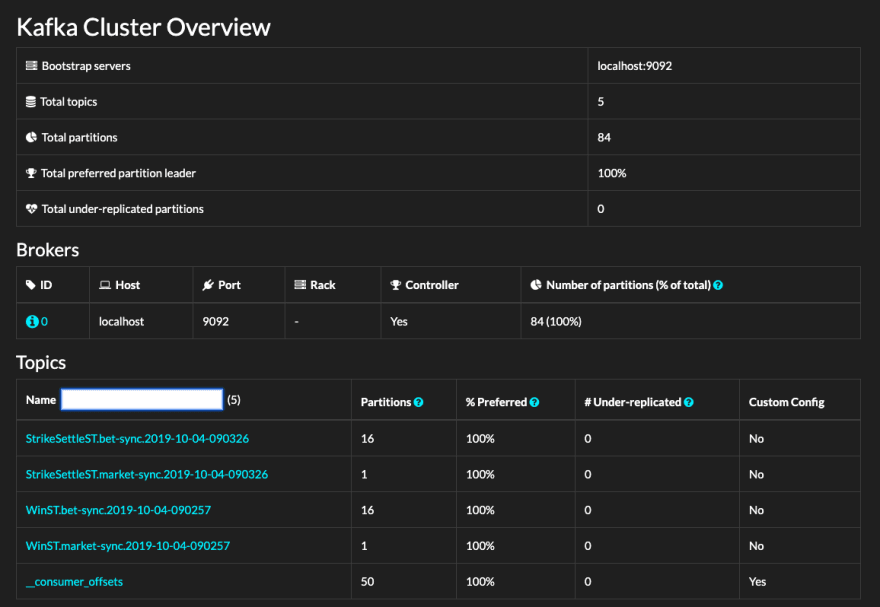
The Cluster Overview screen is the landing page of the web UI.

You get to see the overall layout of the cluster — the individual brokers that make it up, their addresses, and some key broker stats — whether they are a controller and the number of partitions each broker owns. The latter is quite important — as your cluster size and the number of topics (and therefore, partitions) grows, you generally want to see an approximately level distribution of partitions across the cluster.
Next is the Topics List, which in most cases is what you're really here for. Any reasonably-sized, microservices-based ecosystem might have hundreds, if not thousands of topics. As you'd expect, the list is searchable. The stats displayed alongside each topic are fairly ho-hum. The one worth noting is the under-replicated column. Essentially, it's telling us the number of partition replicas that have fallen behind the primary. Zero is a good figure. Anything else is indicative of either a broker or a network issue that requires immediate attention.
Note: Kafdrop is a discovery exploration tool; it is not a real-time monitoring tool. You should instrument your brokers and raise alerts when things go awry.
Listing Topics
Click on a topic on the list to get to the Topic Overview screen.
The screen is subdivided into four sections.
On the top-left, there is a summary of the topic stats — a handy view, not dissimilar to what you would have seen in the cluster overview.
On the top-right, you can view the custom configuration. In the example above, the topic runs a stock-standard config, so there's nothing to see. Had the configuration been overridden, you'd see a set of custom values like in the example below.

The bottom-left section enumerates over the partitions. The partition indexes are links — clicking through will reveal the first 100 messages in the topic.
There are several interesting parameters displayed in this section:
| PARAMETer | DESCRIPTION |
| First offset | Also known as the low-water mark, this is the offset of the first retained message, or the high-water mark if the partition is currently void of messages. The first offset is monotonically non-decreasing with respect to any write (and by implication, read) operation that may be performed on the partition, including publishing of messages and the routine purge and compaction operations. |
| Last offset | The offset will be assigned to the next message. (This is also known as the high-water mark.) Akin to the first offset, the last offset is monotonically non-decreasing. |
| Size | The quantity of retained messages within the partition. |
| Leader Node | The ID of the current leader node. |
| Replica Nodes | The broker IDs that have been assigned a replica of the partition. This set includes the leader node. |
| In-sync Replica Nodes | A subset of the replica nodes that only includes in-sync nodes. |
| Offline Replica Nodes | A subset of the replica nodes that only includes offline brokers. Anything other than an empty set suggests an issue with the broker nodes or the network and requires urgent attention. |
| Preferred Leader | A yes/no value, indicating whether the current leader is configured as the preferred leader. |
| Under-replicated | A yes/no value, indicating that one or more replica nodes have fallen behind the primary. Under normal circumstances, there should be no under-replicated partitions. |
The consumers section on the bottom-right lists the consumer group names, as well as their aggregate lag (the sum of all individual partition lags).
Viewing Consumer Groups
Clicking on the consumer group on the Topic Overview gets you into the Consumer View. This screen provides a comprehensive breakdown of a single consumer group.

The view is sectioned by topic. For each topic, a separate table lists the underlying partitions. Against each partition, we see the committed offset, which we can compare against the first and last offsets to see how our consumer is tracking. Conveniently, Kafdrop displays the computed lag for each partition, which is aggregated at the footer of each topic table.
Note: Some amount of lag is unavoidable. For every message published, there will invariably be a quantum of time between the point of publishing and the point of consumption. In Kafka, this period is usually in the order of tens or hundreds of milliseconds, depending on both the producer and consumer client options, network configuration, broker I/O capabilities, the size of the pagecache and a myriad of other factors. What you need to look out for is growing lag — suggesting that the consumer is either unable to keep up or has stalled altogether. In the latter case, you'll also notice that the lag isn't being depleted even when the producer is idling. This is when you'll need to ALT-TAB away from Kafdrop into your favourite debugger.
Viewing Messages
The Message View screen is the coveted topic viewer that has in all likelihood brought you here. You can get to the message view in one of two ways:
- Click the View Messages button on the Topic Overview screen.
- Click the individual partition link in the Topic Overview.

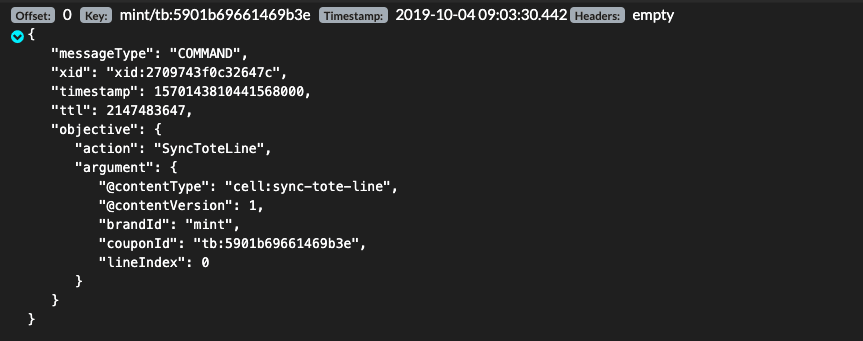
It's exactly what you'd expect — a chronologically-ordered list of messages (or records, in Kafka parlance) for a chosen partition.
Each entry conveniently displays the offset, the record key (if one is set), the timestamp of publication, and any headers that may have been appended by the producer.
There's another little trick up Kafdrop's sleeve. If the message happens to be a valid JSON document, the topic viewer can nicely format it. Click on the green arrow on the left of the message to expand it.

Conclusion
The more you use Kafka, the more you come to discover and appreciate its true potential — not just as a versatile event streaming platform, but as a general-purpose messaging middleware that lets you assemble complex business systems from asynchronous, loosely coupled services.
You'll invariably experience the frustrations that are to be expected from a technology that has only recently entered the mainstream, by comparison with the more mature MQ brokers of yore. What's reassuring is that the open-source community hasn't stood still, producing an evolving ecosystem, complete with the documentation and tooling necessary for us to get on with our jobs. The least we can do in return is raise a pull request once in a while or maybe answer a StackOverflow question or three.
Was this article useful to you? I'd love to hear your feedback, so don't hold back! If you are interested in Kafka or event streaming, or just have any questions, follow me on Twitter.
Further Reading
Apache Kafka With Scala Tutorial
Introduction to Event Streaming With Kafka and Kafdrop
Kafka Administration and Monitoring UI Tools


