Digging Out Data With Adobe PDF Extract API
There is an untold amount of scientific data in the millions of reports and scientific studies over the past few centuries. While much is digitized into easy-to-use PDF formats, the information inside may still be locked away so that it isn’t as easy as it could be to work with it in an aggregate manner. Our recently released PDF Extract API provides a powerful way to get the raw text of a document and intelligently understand the content within. This article will demonstrate how to use this API to gather and aggregate an extensive data set into a unified whole.
Our Data
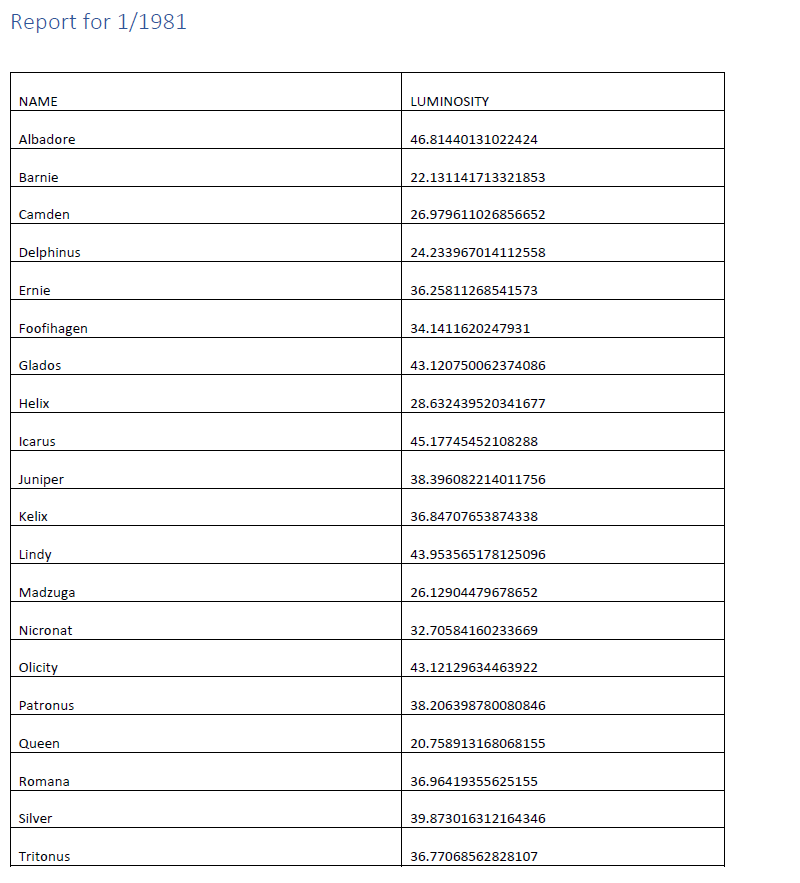
For this hypothetical example, I imagine an astronomy organization (aptly named Department of Star Light) that examines the luminosity of stars. Before I say anything more, please note I am not an astronomer nor a scientist. Please remember this is all a hypothetical example. Anyway, the DSL (a government agency, so of course, it goes by an acronym) studies the brightness of a set of stairs. Every year, it creates a multipage report on these stars. The report contains a cover page and then twelve pages of tables representing each month of the year.

The DSL operated for twenty years, studying and reporting on the same stars. This is a wealth of information, and while they are easy to read and store in PDF format, how would you go about gathering the data and analyzing it over the entire period? That’s 20 files, 12 pages of tables each, at 240 tables. There are twenty stars analyzed, so that’s 4,800 individual stats.
All of this data is in an electronic format, so you could, in theory, copy and paste the data. But that’s prone to error and wouldn’t scale (imagine if the data stretched to fifty years, weekly reports, and one hundred stars). Here’s where PDF Extract can save the day. I’m using our Node SDK for my demo, but you can also use our Java or Python SDKs. If you’re using something else, we’ve also got a REST API you can use.
PDF Extract supports returning multiple things from a PDF:
- Text (as well as font, position, organizational information, and more, so a heck of a lot more than just the text itself)
- Images
- Tables
In our case, getting to the tables is what we need. At a high level, we need to iterate over every available PDF, extract the tables from them, and then later, our code will parse those tables into one unified data set.
Our docs cover multiple examples of extracting tabular data from PDFs. The relevant portion of the code comes to this block:
const options = new PDFServicesSdk.ExtractPDF.options.ExtractPdfOptions.Builder()
  .addElementsToExtract(PDFServicesSdk.ExtractPDF.options.ExtractElementType.TABLES)
  .addTableStructureFormat(PDFServicesSdk.ExtractPDF.options.TableStructureType.CSV)
  .build();
The entire operation is a few more lines of code, but that’s it. What you’ll see, however, is that the code to handle our set of data itself is more complex than the extraction. We can quickly get that data. We need to work a bit harder to aggregate it.
The Solution
My solution boils down to the following steps:
1) Scan our document folder for our PDFs. This is done via a glob pattern on the folder. I use the excellent globby NPM package for this.
const pdfs = await globby('./gen/*.pdf');2) See if we extracted the data already. I wrote my code such that once it extracted and parsed the relevant information, it stored the result “next” to the PDF. We may get more data in the future, rerun the script, and not have it repeat work unnecessarily.
// pdf is the filename we are checking
// datafile would translate foo.pdf to foo.json
let datafile = pdf.replace('.pdf', '.json');
if(!fs.existsSync(datafile)) {
    console.log(`Need to fetch the data for ${pdf}`);
    data = await getData(pdf);
    fs.writeFileSync(datafile, JSON.stringify(data), 'utf8');
3) If the PDF hasn’t been analyzed, we need to do that work. This happens in the nicely named getData function. This function has the following sub-steps. First, it grabs the tables using the PDF Extraction API:
const credentials = PDFServicesSdk.Credentials
    .serviceAccountCredentialsBuilder()
    .fromFile('pdftools-api-credentials.json')
    .build();

const executionContext = PDFServicesSdk.ExecutionContext.create(credentials);

const options = new PDFServicesSdk.ExtractPDF.options.ExtractPdfOptions.Builder()
    .addElementsToExtract(PDFServicesSdk.ExtractPDF.options.ExtractElementType.TABLES)
    .addTableStructureFormat(PDFServicesSdk.ExtractPDF.options.TableStructureType.CSV)
    .build();

const extractPDFOperation = PDFServicesSdk.ExtractPDF.Operation.createNew();
const input = PDFServicesSdk.FileRef.createFromLocalFile(pdf,PDFServicesSdk.ExtractPDF.SupportedSourceFormat.pdf);

extractPDFOperation.setInput(input);
extractPDFOperation.setOptions(options);
let output = './' + nanoid() + '.zip';

try {
    let result = await extractPDFOperation.execute(executionContext);
    await result.saveAsFile(output);
} catch(e) {
    console.log('Exception encountered while executing operation', err);
    reject(err)
}
The result of this call is a zip file, so I’ve used a library (nanoid) to generate a random file name. Next, we need to get the tables out of the zip:
// ok, now we need to get tables/*.csv from the zip
const zip = new StreamZip.async({ file: output });
const entries = await zip.entries();
let csvs = [];
for (const entry of Object.values(entries)) {
    if(entry.name.endsWith('.csv')) csvs.push(entry.name);
}
So, at this point, we’ve got the names of 12 CSV files in the zip. We’re going to need to parse them all and add them to an array (one item per month):
let result = [];for(let i=0; i<csvs.length;i++) {
    const data = await zip.entryData(csvs[i]);
    let csvContent = data.toString();
    let csvData = await csv().fromString(csvContent);
    result.push(csvData);
}
This data is returned and stored next to the PDF in JSON format. The data (I’ll have links at the end so you can see it all yourself) is an array of arrays. Each element in the top-level array represents one month. Then the second level array is the array of tabular data. Here is one instance:
[
    {
        "NAME": "Albadore",
        "LUMINOSITY": "44.377727966701904"
    },
    {
        "NAME": "Barnie",
        "LUMINOSITY": "22.82641486947966"
    },
    {
        "NAME": "Camden",
        "LUMINOSITY": "30.147538516875166"
    },
    {
        "NAME": "Delphinus",
        "LUMINOSITY": "24.18838138551451"
    },
    {
        "NAME": "Ernie",
        "LUMINOSITY": "39.326469491032285"
    },
    {
        "NAME": "Foofihagen",
        "LUMINOSITY": "34.09839876252938"
    },
    {
        "NAME": "Glados",
        "LUMINOSITY": "45.42275137909815"
    },
    {
        "NAME": "Helix",
        "LUMINOSITY": "28.434317384475182"
    },
    {
        "NAME": "Icarus",
        "LUMINOSITY": "45.26036772094769"
    },
    {
        "NAME": "Juniper",
        "LUMINOSITY": "37.61983037130726"
    },
    {
        "NAME": "Kelix",
        "LUMINOSITY": "34.33577955268733"
    },
    {
        "NAME": "Lindy",
        "LUMINOSITY": "44.132514920041444"
    },
    {
        "NAME": "Madzuga",
        "LUMINOSITY": "23.429262283398895"
    },
    {
        "NAME": "Nicronat",
        "LUMINOSITY": "32.57940088137253"
    },
    {
        "NAME": "Olicity",
        "LUMINOSITY": "41.76234700460494"
    },
    {
        "NAME": "Patronus",
        "LUMINOSITY": "38.57095289213085"
    },
    {
        "NAME": "Queen",
        "LUMINOSITY": "20.83277986794452"
    },
    {
        "NAME": "Romana",
        "LUMINOSITY": "39.28237819440117"
    },
    {
        "NAME": "Silver",
        "LUMINOSITY": "39.03680756359309"
    },
    {
        "NAME": "Tritonus",
        "LUMINOSITY": "36.96249959958089"
    }
],
You’ll notice the numerical values are quoted. I could have converted them to proper numbers before saving.
4) Ok, so at this point, we’ve created, or read in, many years of star data. This information is in a variable called data. I've got a variable named result that will store everything:
let year = pdf.split('/').pop().split('.').shift();
result.push({
    year,
    data
});
I add the year to the value to help me keep things organized.
5) And then finally, the result is written out to the file system:
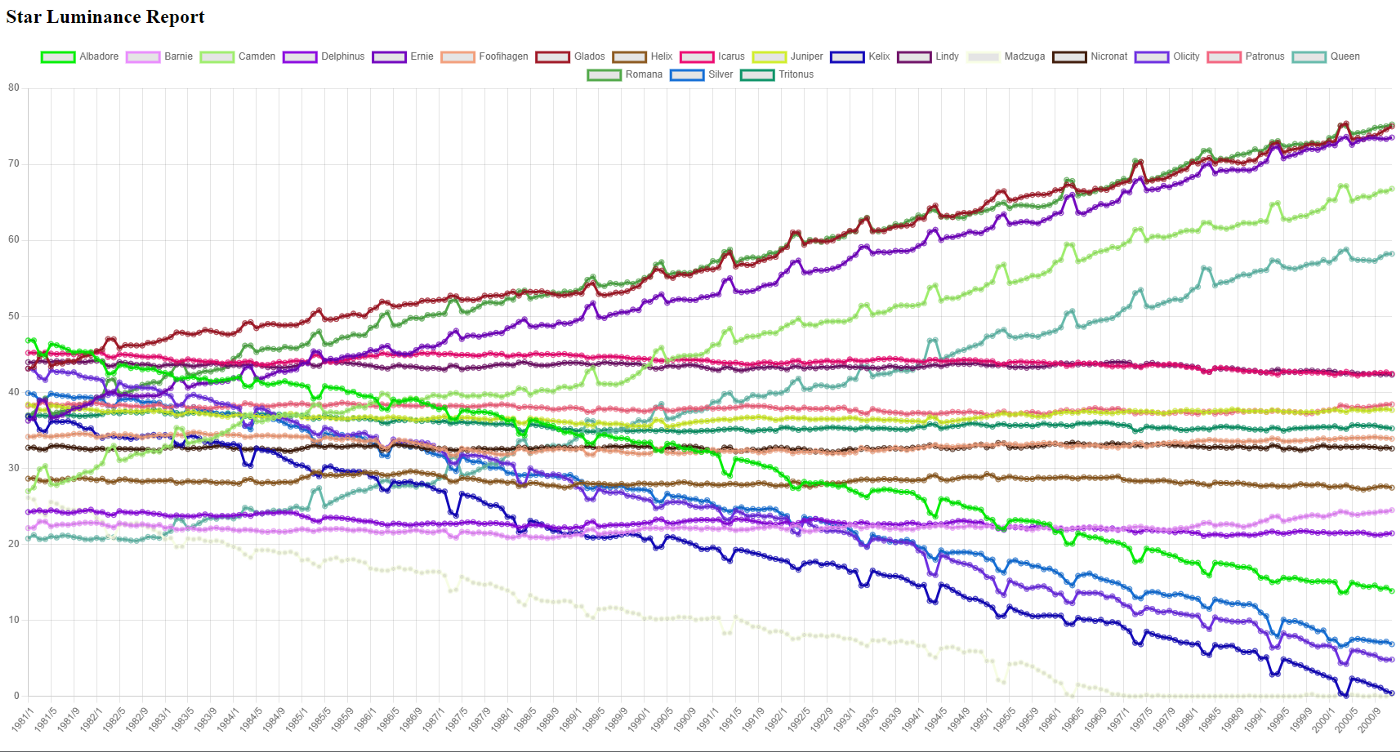
fs.writeFileSync(outputFile, JSON.stringify(result), 'utf8');All in all, that all seems a bit complex, and it is. We had data across different pages and different PDFs, but the Extract API was able to expose the data I needed. What’s incredible is that at this point, I’ve got the entirety of the information in one file (a database would have worked well, too, of course), and I can slice and dice it as I see fit. I whipped up a quick demo using Chart.js and was able to graph all the stars and their change over time:

Figure 1 Graph of the stars and their change over time.
This, too, was a bit of work — namely, converting my data to a format Chart.js could grok, but the critical thing to keep in mind is that the data is now ready for multiple uses.

