AWS CloudTrail vs. CloudWatch: Features and Instructions

In today’s digital world, cloud computing is necessary for businesses of all types and sizes, and Amazon Web Services (AWS) is undoubtedly the most popular cloud computing service provider. AWS provides a vast array of services, including CloudWatch and CloudTrail, that can monitor and log events in AWS resources.
This article will compare AWS CloudWatch and CloudTrail, looking at their features, use cases, and technical considerations. It will also provide implementation guides and pricing details for each.
Summary Comparison of AWS CloudTrail vs. AWS CloudWatch
AWS CloudTrail and AWS CloudWatch offer different functions and features and are designed for specific use cases.
| Concept | AWS CloudTrail | AWS CloudWatch |
|---|---|---|
| Core Purposes | AWS CloudTrail records all API activity within an AWS account to enhance security, ensure compliance, and aid in troubleshooting. | Amazon CloudWatch is an AWS monitoring service that provides a comprehensive view of operational health. |
| Use Cases | Compliance, security, providing a history of AWS infrastructure changes, governance, and forensics | Monitoring, troubleshooting, capacity planning, and resource optimization |
| Logging | CloudTrail events are logs of API activity within your AWS account, providing valuable data for audits, security analysis, and operational troubleshooting. | CloudWatch Logs is an AWS service for the centralized storage, monitoring, and analysis of log files from AWS resources and applications, aiding in pattern detection, troubleshooting, and data archiving. |
| Storage and data processing | CloudTrail records API calls and events in an AWS account, stores them in an S3 bucket for audit and security purposes, provides processing tools for data analysis and automation, retains data for up to 7 years, and delivers events within 15 minutes and log files to S3 every 5 minutes. | CloudWatch collects and stores data from AWS resources and applications in a durable repository, processes it in real-time for visualizations and notifications, retains metrics for 15 months and logs for 2 years, and supports high-resolution data points with granularity adjusted based on the age of the requested data. |
| Query and analysis | Using CloudTrail Insights, you can query AWS Lambda transactions by selecting the relevant log group, entering keywords like “Invoke” in the query editor, applying filters, executing complex queries with the query language, viewing results in a table or chart format, and scheduling the query to run regularly for continuous monitoring and analysis. | CloudWatch allows querying and analysis of log data using labels and aggregations, which involves selecting a log group, entering search values in the query editor, adding labels as key-value pairs, performing complex queries using the CloudWatch Logs Insights query language, executing the query, and optionally saving and scheduling it for regular monitoring and analysis over time. |
| Pricing and Cost Considerations | AWS CloudWatch and CloudTrail offer separate 12-month free tiers with costs based on metrics, logs, and storage use. Various factors come into play that affect the pricing, which depends on the particulars for each service. | |
Understanding the Core Purposes of AWS CloudWatch and AWS CloudTrail
Amazon CloudWatch is a monitoring service for AWS resources and the applications you run on Amazon Web Services. Its core purpose is to provide data and actionable insights to monitor your applications, understand and respond to system-wide performance changes, optimize resource utilization, and get a unified view of operational health.
AWS CloudTrail is a service that provides event history for AWS resources. It records every API call made in your account, including who made the call, when, and from where. Its core purposes are security, compliance, and troubleshooting.
AWS CloudWatch Features
- Metrics: CloudWatch collects, stores, and analyzes performance data, called metrics, from AWS resources and applications. Metrics are time-ordered sets of data points that help you monitor the performance of your applications and infrastructure.
- Alarms: CloudWatch allows you to create alarms based on metric thresholds. When a metric crosses a specified threshold, an alarm is triggered. You can configure actions, such as sending notifications or stopping instances, to be performed automatically when an alarm is triggered.
- Logs: CloudWatch Logs enable you to centralize, store, and analyze log data from AWS resources and applications. You can also set up alarms for specific log patterns or use CloudWatch Logs Insights to search, analyze, and visualize your logs.
- Events: CloudWatch Events is a service that delivers a near-real-time stream of events describing changes to your AWS resources. You can create rules to match specific events and take automated action in response to these events, using AWS Lambda functions, SNS notifications, or other AWS services.
- Anomaly detection: This feature uses machine learning algorithms to identify unusual behavior that is reflected in your metrics. This information can let you proactively address potential issues before they impact your applications or infrastructure.
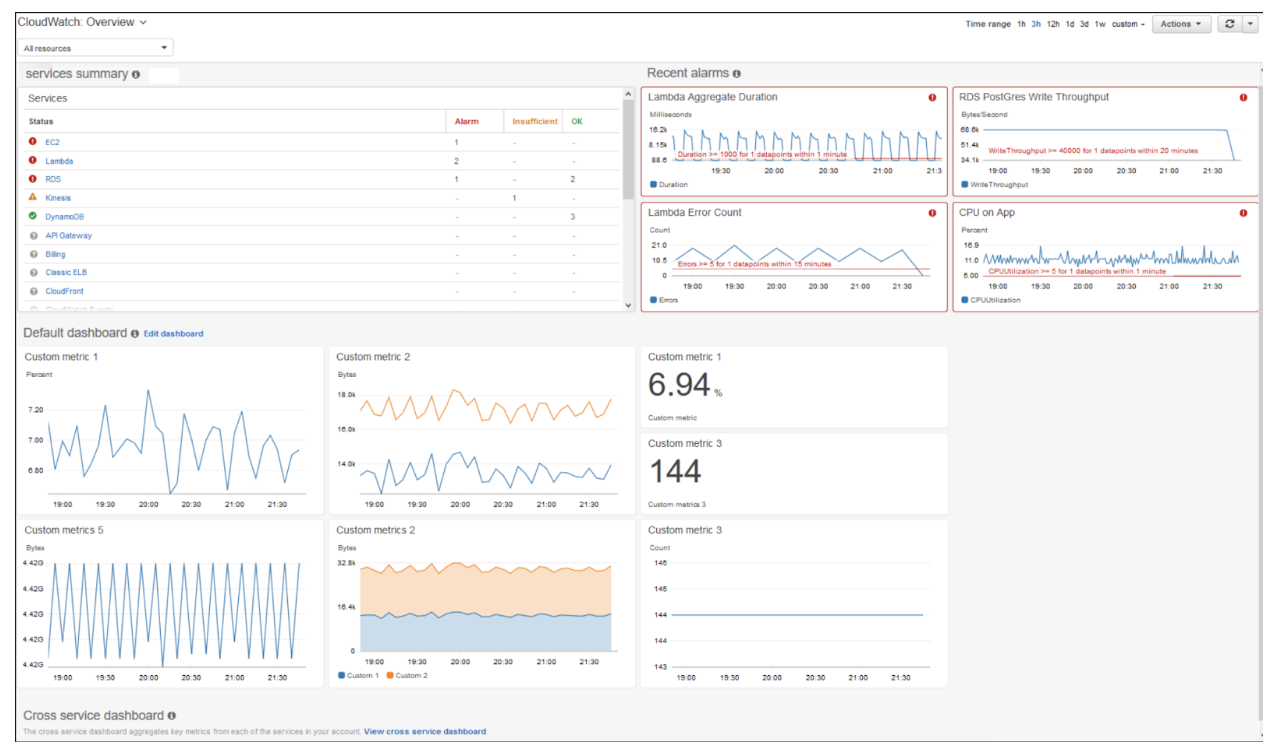
- Custom dashboards: CloudWatch allows you to create custom dashboards to visualize your metrics and alarms. Dashboards can be personalized to display key performance indicators (KPIs) and operational health metrics for a specific set of resources or applications.
AWS CloudTrail Features
- Activity logging: CloudTrail records account activity by logging AWS Management Console sign-in events and API calls made in your AWS account. These logs can help you track user activity and resource changes for security analysis, compliance auditing, and operational troubleshooting.
- Event history: CloudTrail retains API call history for the last 90 days, allowing you to access and search your recent account activity.
- Multi-region support: CloudTrail can consolidate API activity logs from multiple AWS regions, providing a unified view of your account activity across all regions.
- Data event logging: CloudTrail can capture API calls for Amazon S3 object-level operations and AWS Lambda function executions. This feature enables you to log access to specific resources for detailed analysis and auditing.
- Integration with other AWS services: CloudTrail logs can be delivered to Amazon S3, Amazon CloudWatch Logs, and Amazon SNS for further analysis, alerting, and archiving. Integrating these services allows you to build custom workflows and automate responses to specific events in your AWS account.
- Log file encryption: CloudTrail supports log file encryption using AWS Key Management Service (KMS) keys, ensuring that your log data is secure and accessible only to authorized users.
- Log file validation: CloudTrail allows you to enable log file validation, ensuring your log files’ integrity and authenticity. With validation enabled, you can be confident that your log data has not been tampered with or altered.
AWS CloudTrail and AWS CloudWatch Use Cases
Amazon CloudWatch tracks metrics, log files, and alarms for cloud resources, applications, and custom metrics on AWS. It offers system-wide visibility into resource utilization, application performance, and operational health across Amazon EC2, DynamoDB, RDS, and more. With automatic dashboards featuring AWS best practices, you can easily explore metrics and alarms and identify the root cause of performance issues.
- Event detection and response: CloudWatch can be used to detect and respond to events such as instance failures, auto-scaling actions, and application errors, through the use of alarms, notifications, and automated actions.
- Application performance monitoring (APM): CloudWatch can be used for APM, including monitoring application performance, tracking custom metrics, and tracing application requests.
- Custom metrics: CloudWatch can be used to track and visualize custom metrics. You can also export these metrics to third-party monitoring tools.
- Disaster recovery: CloudWatch can be used to monitor and ensure the availability and performance of disaster recovery resources such as backup and recovery servers.
Amazon CloudTrail is a web service that logs account activity and stores the files in an Amazon S3 bucket. It offers visibility into user actions by recording information such as the requester, services used, actions performed, parameters, and response elements. CloudTrail facilitates tracking resource changes, troubleshooting operational issues, and ensuring compliance with internal policies and regulatory standards.
- Change management: CloudTrail can be used to track changes made to AWS resources over time. It provides a complete history of all the changes made to each resource.
- Security and compliance: CloudTrail can be used for security and compliance monitoring, including monitoring for unauthorized access, security events, and compliance violations. It can be used to meet various compliance requirements, such as PCI, HIPAA, SOC, etc.
- Governance and auditing: CloudTrail logs can be used for governance and auditing purposes, providing an audit trail of all the activities and changes made to the AWS resources.
- Risk management: CloudTrail logs can be used to identify risks associated with AWS resources as well as misconfigurations and unauthorized access attempts.
Logging
In this section, we will dive into the AWS CloudWatch Logs service as well as some AWS CloudTrail events to see how each service works.
Amazon CloudWatch Logs
Amazon CloudWatch Logs enables you to monitor and troubleshoot systems and applications using existing log files, providing near-real-time analysis of specific phrases, values, or patterns. For instance, you can set alarms based on system log errors or visualize latency graphs from application logs. CloudWatch Logs stores the log data indefinitely in highly durable, cost-effective storage, eliminating concerns about hard drive capacity.
Users can leverage CloudWatch Logs for:
- Real-time application and system monitoring: You can leverage log data to monitor applications and systems without any code changes. For example, you can track error occurrences in application logs and receive notifications when error rates surpass specified thresholds.
- Long-term log retention: The CloudWatch Logs Agent seamlessly transfers rotated and non-rotated log files into the log service, granting access to raw log event data when needed.
CloudWatch Logs Agent is a software agent provided by AWS that can be installed on your servers to automatically collect, process, and transmit log data from your applications or system to Amazon CloudWatch Logs.
The CloudWatch Logs Agent is compatible with various operating systems, including Amazon Linux, Ubuntu, CentOS, Red Hat Enterprise Linux, and Windows.
Amazon CloudTrail Events
When an event occurs in an account, CloudTrail evaluates whether the event matches the settings for the trails configured. Only events that match the trail settings are delivered to the Amazon S3 bucket and Amazon CloudWatch Logs log group.
Multiple trails can be configured differently so that the trails process and log only the events that you specify. For example, one trail can log read-only data and management events to deliver all read-only events to one S3 bucket. Another trail might log only write-only data and management events so that all write-only events are delivered to a separate S3 bucket.
You can also configure your trails to have one trail set up to log and deliver all management events to one S3 bucket and configure another trail to log and deliver all data events to another S3 bucket.
You can configure your trails to log the following types of events:
- Data events: These events provide visibility into the resource operations performed on or within a resource. These are also known as data plane operations.
- Management events: Management events provide visibility into management operations performed on resources in your AWS account. These are also known as control plane operations. Management events can also include non-API events that occur in your account. For example, when a user logs into your account, CloudTrail can log the ConsoleLogin event.
- Insights events: Insights events capture unusual activity detected in your account. If you have Insights events enabled, and CloudTrail detects unusual activity, the Insights events are logged to the destination S3 bucket for your trail but in a different folder. You can also see the type of Insights event and the incident time period when you view Insights events on the CloudTrail console. Unlike other types of events captured in a CloudTrail trail, Insights events are logged only when CloudTrail detects changes in your account’s API usage that differ significantly from the account’s typical usage patterns. Insights events are generated only for write management APIs.
Storage and Data Processing
Here’s how AWS CloudWatch and AWS CloudTrail process and store data.
| CloudWatch | CloudTrail | |
|---|---|---|
| Collection | CloudWatch collects data from various sources, including AWS resources such as EC2 instances, RDS databases, and Lambda functions, as well as custom metrics and logs from applications. | CloudTrail captures API calls and management events made within an AWS account, including events generated by AWS services, the AWS Management Console, the AWS Command Line Interface (CLI), and AWS SDKs. |
| Storage | CloudWatch stores collected data in its own metrics repository, AWS CloudWatch Logs, which is an AWS-managed service. The metrics repository is optimized for high availability and durability, with multiple copies of data stored across multiple Availability Zones to ensure data reliability. | CloudTrail stores the collected data in an Amazon S3 bucket, which can be used for auditing, security analysis, and compliance purposes. The data is stored in a format optimized for search and retrieval. |
| Processing | CloudWatch processes the collected data in real-time, using various algorithms to aggregate, analyze, and visualize it. This enables customers to create custom dashboards, set alarms and notifications, and perform root cause analysis. | CloudTrail provides various tools for processing the collected data, including AWS Lambda functions, AWS Glue jobs, and Amazon Athena queries. Customers can use these tools to extract specific data, perform analysis, and automate tasks. |
| Retention | CloudWatch retains metrics data for up to 15 months, allowing customers to perform historical analysis and track long-term trends. Log data retention can be configured for up to two years. | CloudTrail retains event data for up to 90 days by default, but customers can configure the retention period to be longer: up to seven years. |
| Delivery | CloudWatch supports high-resolution, one-second data points and one-minute granularity for metrics storage. Metrics may be received at varying intervals, such as three or five minutes. If not specified as high-resolution, metrics default to one-minute resolution. Data availability depends on the age of the requested data and retention schedules. For instance, requesting one-minute data from 10 days ago yields 1,440 data points, while a request from five months ago auto-adjusts to one-hour granularity with no GetMetricStatistics API output. | Typically, CloudTrail delivers an event within 15 minutes of the API call. CloudTrail delivers log files to the S3 bucket approximately every five minutes. CloudTrail does not deliver log files if no API calls are made on your account. Additionally, Simple Notification Service (SNS) can be used with CloudTrail to send notifications whenever a new log file gets delivered. |
Query and Analysis
Querying and analyzing data from CloudWatch and CloudTrail can provide valuable insights into the behavior of your AWS environment, helping you identify issues, optimize performance, and ensure compliance. Note that AWS CloudWatch Logs and AWS CloudTrail both deal with logging, but they are used for different purposes and log different types of information.
Let’s explore some of the tools and techniques available for querying and analyzing data from CloudWatch and CloudTrail.
AWS CloudWatch
To query and analyze data using labels and aggregations from AWS CloudWatch, follow these steps:
- Log into the AWS Management Console and navigate to the CloudWatch dashboard.
- Click on the “Logs” section in the left-hand navigation menu.
- Select the log group that you want to query.
- Click the “Search Log Group” button to open the query editor.
- In the query editor, enter the keywords or values you want to search for in the log data.
- You can also use labels to help organize and filter your log data. Labels are key-value pairs that can be added to log data to provide additional context and allow for more efficient querying.
- To add a label to your log data, include it as a key-value pair in the log message. For example, you could include a label called “environment” with a value of “production” to indicate that the log message is related to a production environment.
- In the query editor, enter a query. For example, you could use the following query to aggregate log data by the “environment” label:
{ PropertySelector EqualityOperator String }
{ $.environment = "production" }- You can also use the CloudWatch Logs Insights query language to perform more complex queries and aggregations. For example, you could use the following query to aggregate log data by both the “environment” and “service” labels:
fields @timestamp, @message
| filter environment = 'production'
| filter service = 'web'
| stats count() by environment, service
This query will return a table showing the number of log messages for each combination of environment and service label values.
- Once you have entered your query, click the “Run query” button to execute it.
- The query results will be displayed in the query editor. You can view the results as a table or as a chart.
- You can also save your query and schedule it to run regularly so that you can monitor and analyze your log data over time.
AWS CloudTrail
For example, to query for AWS Lambda transactions using AWS CloudTrail, you can use the CloudTrail Insights feature. CloudTrail Insights allows you to search and analyze your CloudTrail log data to identify security and operational trends and anomalies.
Here are the steps to query for AWS Lambda transactions using AWS CloudTrail Insights:
- Log into the AWS Management Console and navigate to the CloudTrail dashboard.
- Click on the “Insights” section in the left-hand navigation menu.
- Click the “Create Insights query” button.
- In the query editor, select the CloudTrail log group that contains the AWS Lambda logs you want to search.
- Enter the keywords or values that you want to search for in the log data. For example, you could search for the “Invoke” action, which is used to invoke a Lambda function.
- Use the filter options to narrow down the results based on specific criteria, such as user identity, event time, or region.
- You can also use the CloudTrail Insights query language to perform more complex queries and aggregations. For example, you could use the following query to search for all invocations of a specific Lambda function:
fields eventTime, eventName, awsRegion, sourceIPAddress
| filter (eventName = 'Invoke' AND requestParameters.functionName = 'my-lambda-function')- Once you have entered your query, click the “Run query” button to execute it.
- The query results will be displayed in the query editor. You can view the results as a table or as a chart.
- You can also save your query and schedule it to run regularly so that you can monitor and analyze your AWS Lambda logs over time. Similarly, the process above can be done for any other AWS service.
Implementation Examples
In this section, we will walk through instructions for creating a CloudWatch alarm and creating a trail using AWS CLI and AWS Console. For other approaches, such as using boto3, it is always best to refer to the official AWS documentation.
Creating a CloudWatch Alarm
Shown below is an example of creating a CloudWatch alarm using the AWS CLI:
aws cloudwatch put-metric-alarm --alarm-name CPU_Utilization --alarm-description "Alarm when CPU utilization exceeds 85%" --metric-name CPUUtilization --namespace AWS/EC2 --statistic Average --period 300 --threshold 85 --comparison-operator GreaterThanThreshold --dimensions "Name=InstanceId,Value=i-01234567890" --evaluation-periods 1 --alarm-actions arn:aws:sns:us-west-2:123456789012:SomeTopic --unit PercentThis command creates an alarm that triggers when the CPU utilization of an EC2 instance with the instance ID “i-01234567890” exceeds 85%.
To create a CloudWatch dashboard using the AWS Management Console, follow these steps:
- Navigate to the CloudWatch dashboard in the AWS Management Console.
- Click on “Create dashboard.”
- Select the metrics you want to display on the dashboard.
- Customize the layout and appearance of the dashboard.
- Save the dashboard.
Creating a Trail Using AWS CloudTrail
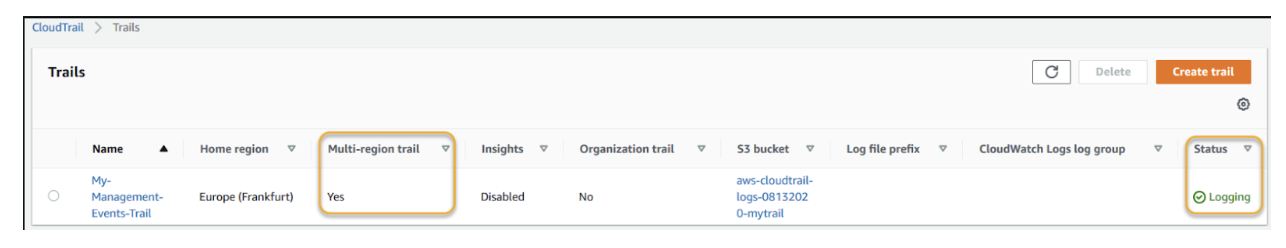
To create a CloudTrail trail using the AWS Management Console, follow the steps below:
- Navigate to the CloudTrail dashboard in the AWS Management Console.
- Click on “Create trail.”
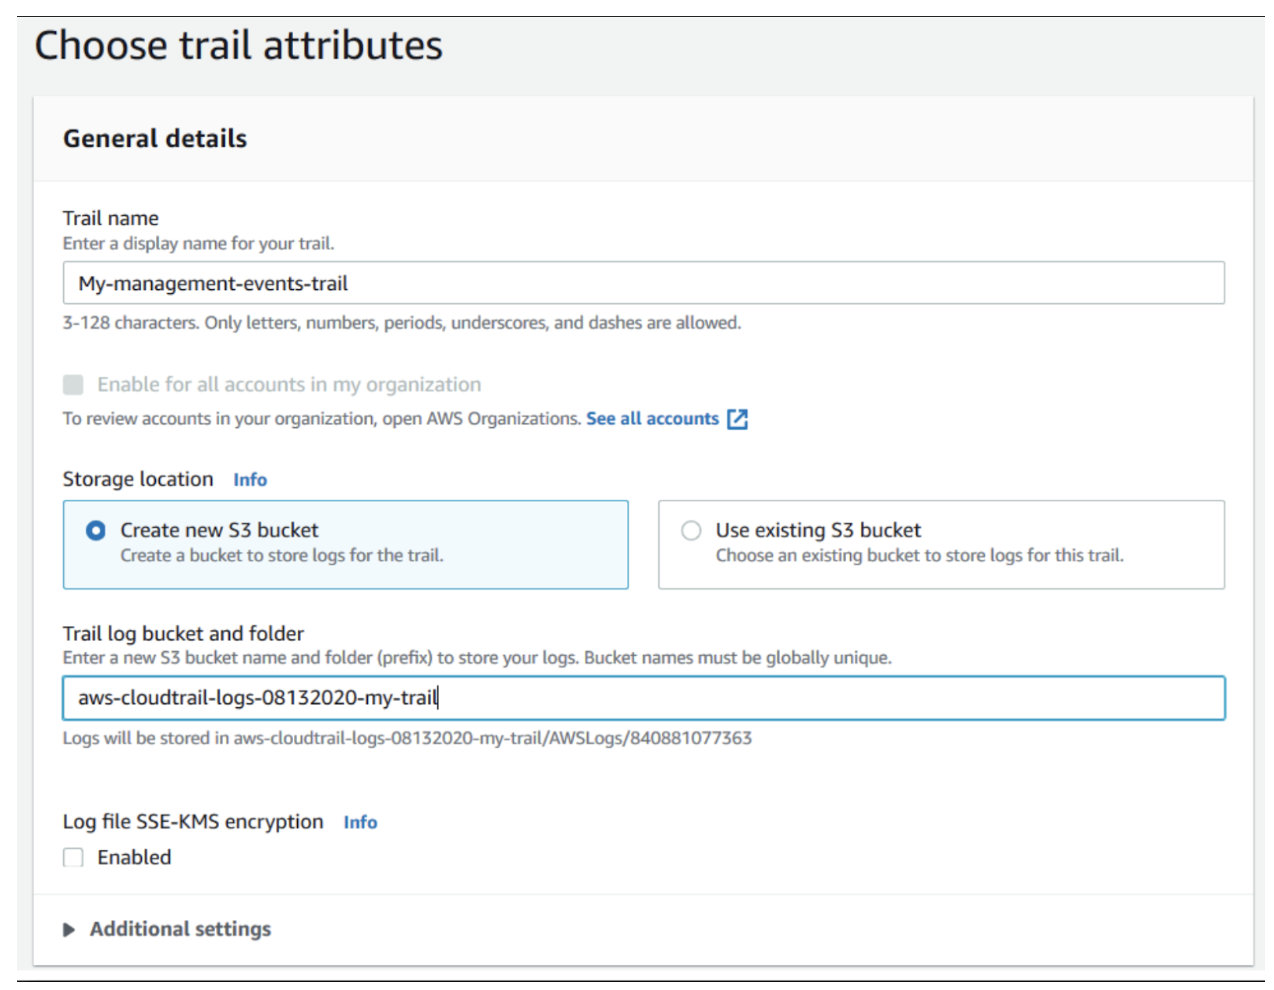
- Enter a name for the trail, and select the S3 bucket where the logs will be stored, as shown in the figures below.
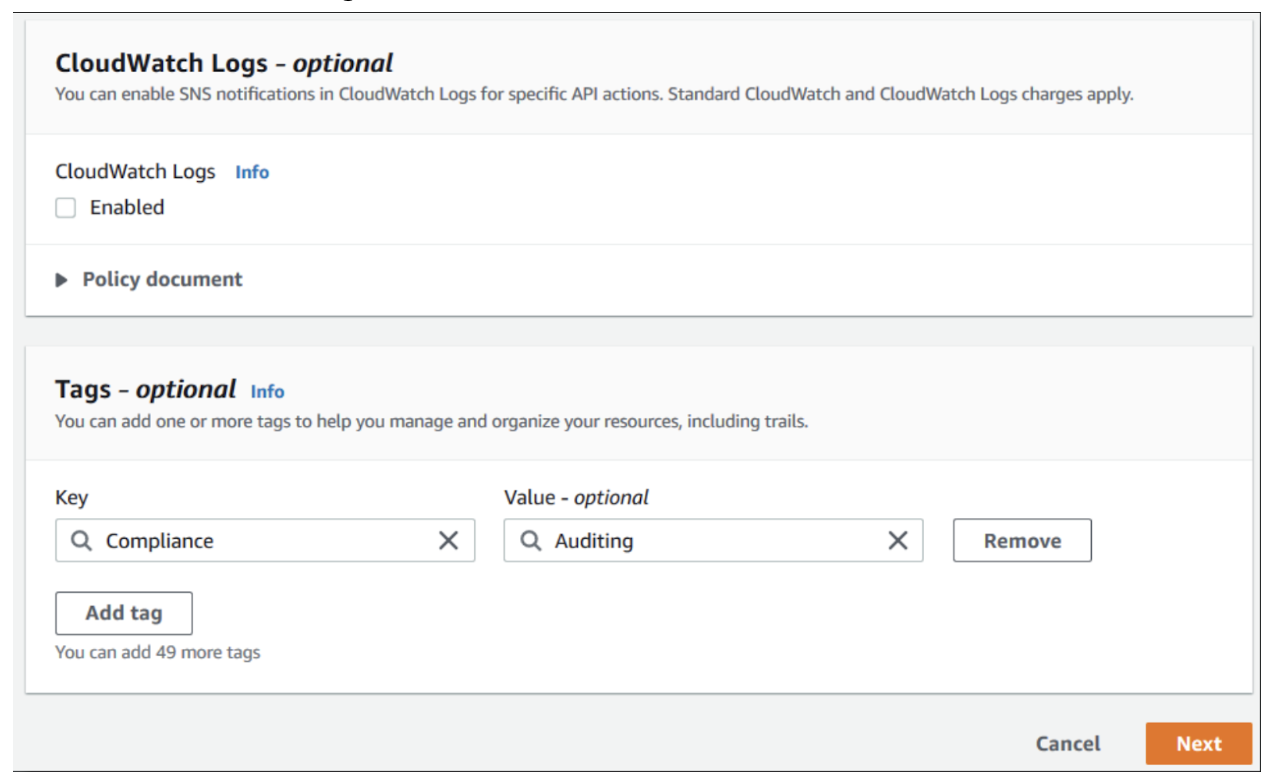
- Enable CloudWatch Logs, if desired.
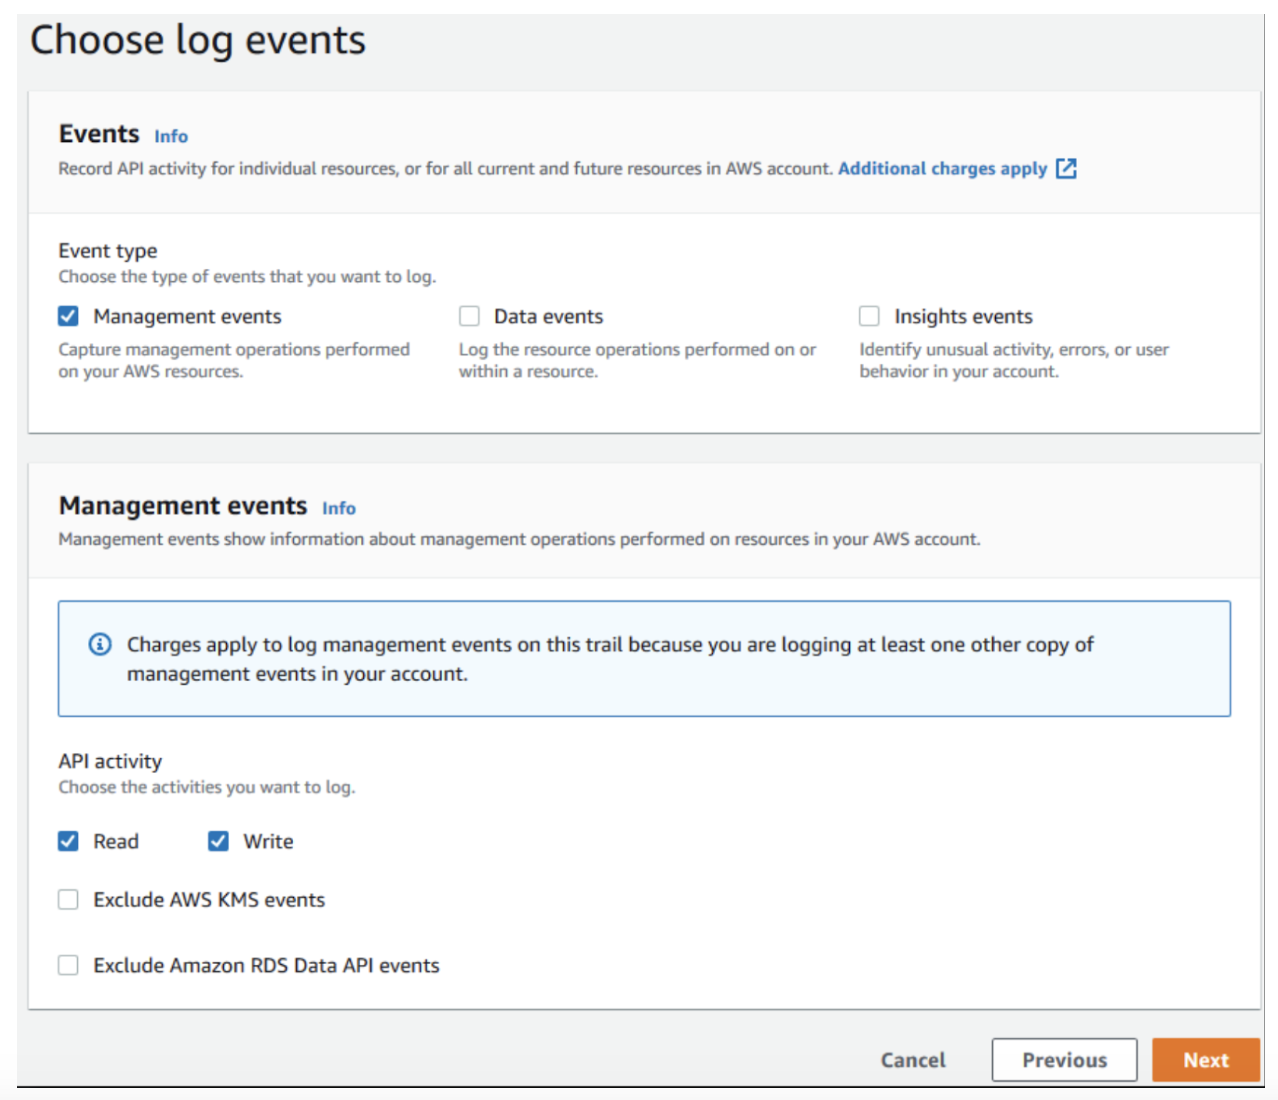
- Select the log events described in the Logging > Amazon CloudTrail events section of this article. The following is a sample figure:
- Save the trail.
Here is an example of how to retrieve CloudTrail logs using the AWS CLI:
aws s3api get-object --bucket aws-cloudtrail-logs-08132020-my-trail --key CloudTrail/AWSLogs/123456789012/CloudTrail/us-east-1/2023/03/27/123456789012_CloudTrail_us-east-1_20200327T0000Z_rndDZT1TtMyLlOoA.json --region us-east-1
Conclusion
AWS CloudWatch and AWS CloudTrail are indispensable tools for effectively managing and monitoring your AWS infrastructure. While CloudWatch excels at providing real-time performance monitoring, alerting, and troubleshooting for your AWS resources, CloudTrail focuses on recording and analyzing API activity, enabling enhanced security and compliance.
