Log4j Bug — Slows Down Your Application
 Learn how to troubleshoot your application.
Recently we were troubleshooting a popular SaaS application. This application was slowing down intermittently. To recover from the problem, the application had to be restarted. This application was slowing down sometimes during high traffic volume periods; sometimes during low traffic periods as well. There was no cohesive pattern.
This sort of application slowing down and restarting it was going on for a while. Then we were engaged to troubleshoot the problem. We uncovered something interesting, thought you might also benefit from our findings, thus writing this article.
Technology Stack
This popular SaaS application was running on the Azure cloud. Below is it's technology stack:
- Spring Framework.
- GlassFish Application Server.
- Java 8.
- Azure cloud.
Troubleshooting
When we were informed about this problem, we captured thread dump from this application right when slowdown was happening. There are multiple options to capture thread dump; we choose 'jstack' tool to capture the thread dump. Note: It's very critical that you obtain the thread dump right when the problem is happening. Thread dumps captured outside the problem duration window wouldn’t be useful.
Now we uploaded the captured thread dump to fastThread.io — online thread dump analysis tool. The tool instantly generated this beautiful report. (We encourage you to click on the hyperlink to see the generated report so that you can get the first-hand experience).
The report instantly narrowed down the root cause of the problem. fastThread.io tool highlighted that 'http-nio-8080-exec-121' thread was blocking 134 application threads. Below is the transitive dependency graph showing the BLOCKED threads:

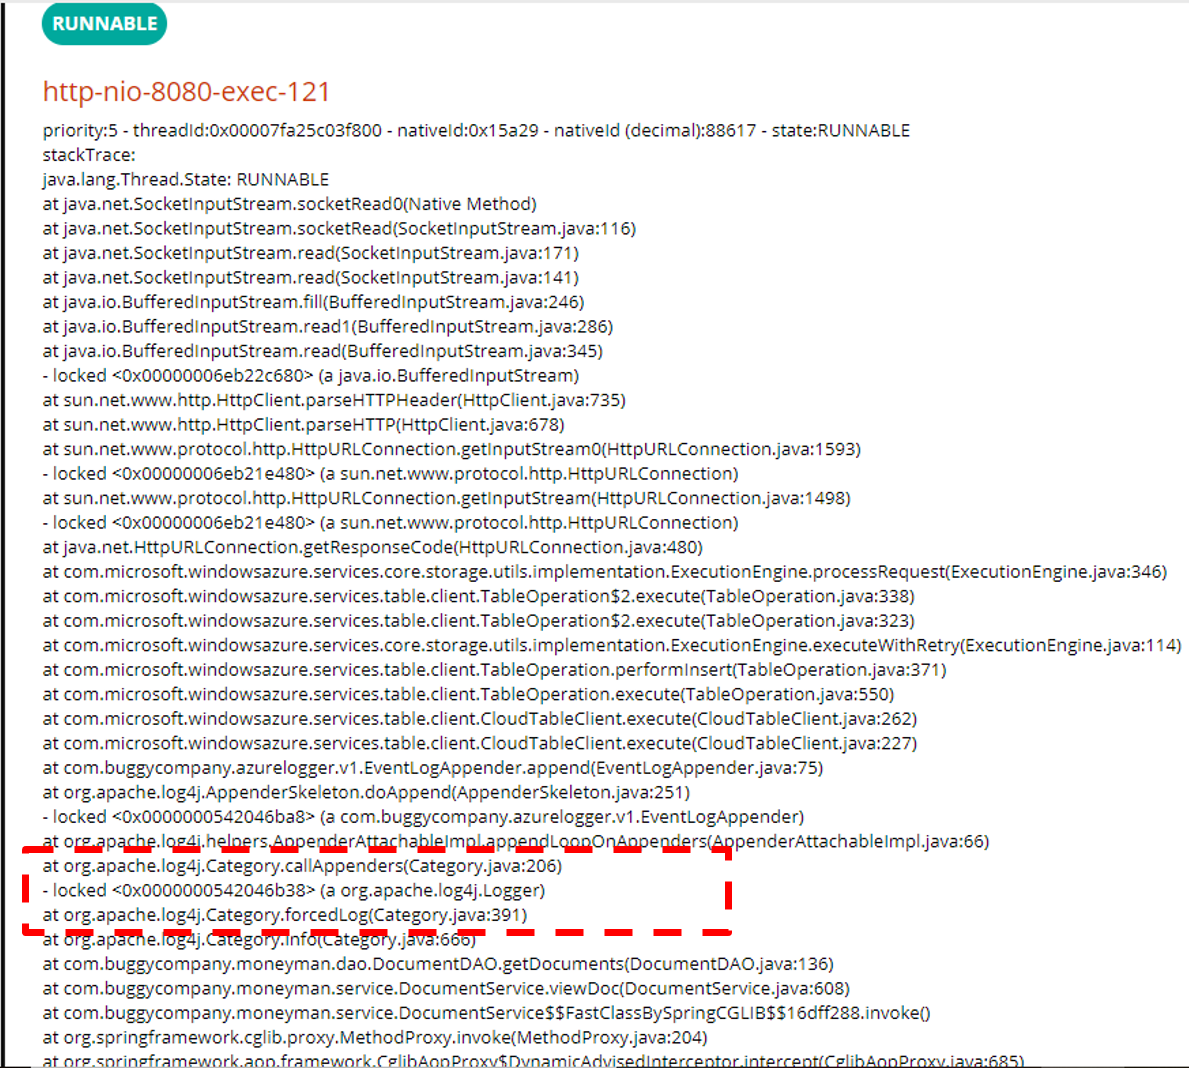
From the graph, you can see 134 applications threads are BLOCKED by 'http-nio-8080-exec-121' thread (first one from left side). When we clicked on the 'http-nio-8080-exec-121' hyperlink in the graph it printed the stack trace of the thread:

I request you to take a close look at the highlighted section of the stack trace. You can see the thread obtaining org.apache.log4j.Logger lock and then moving forward to write the log records into Azure cloud storage.
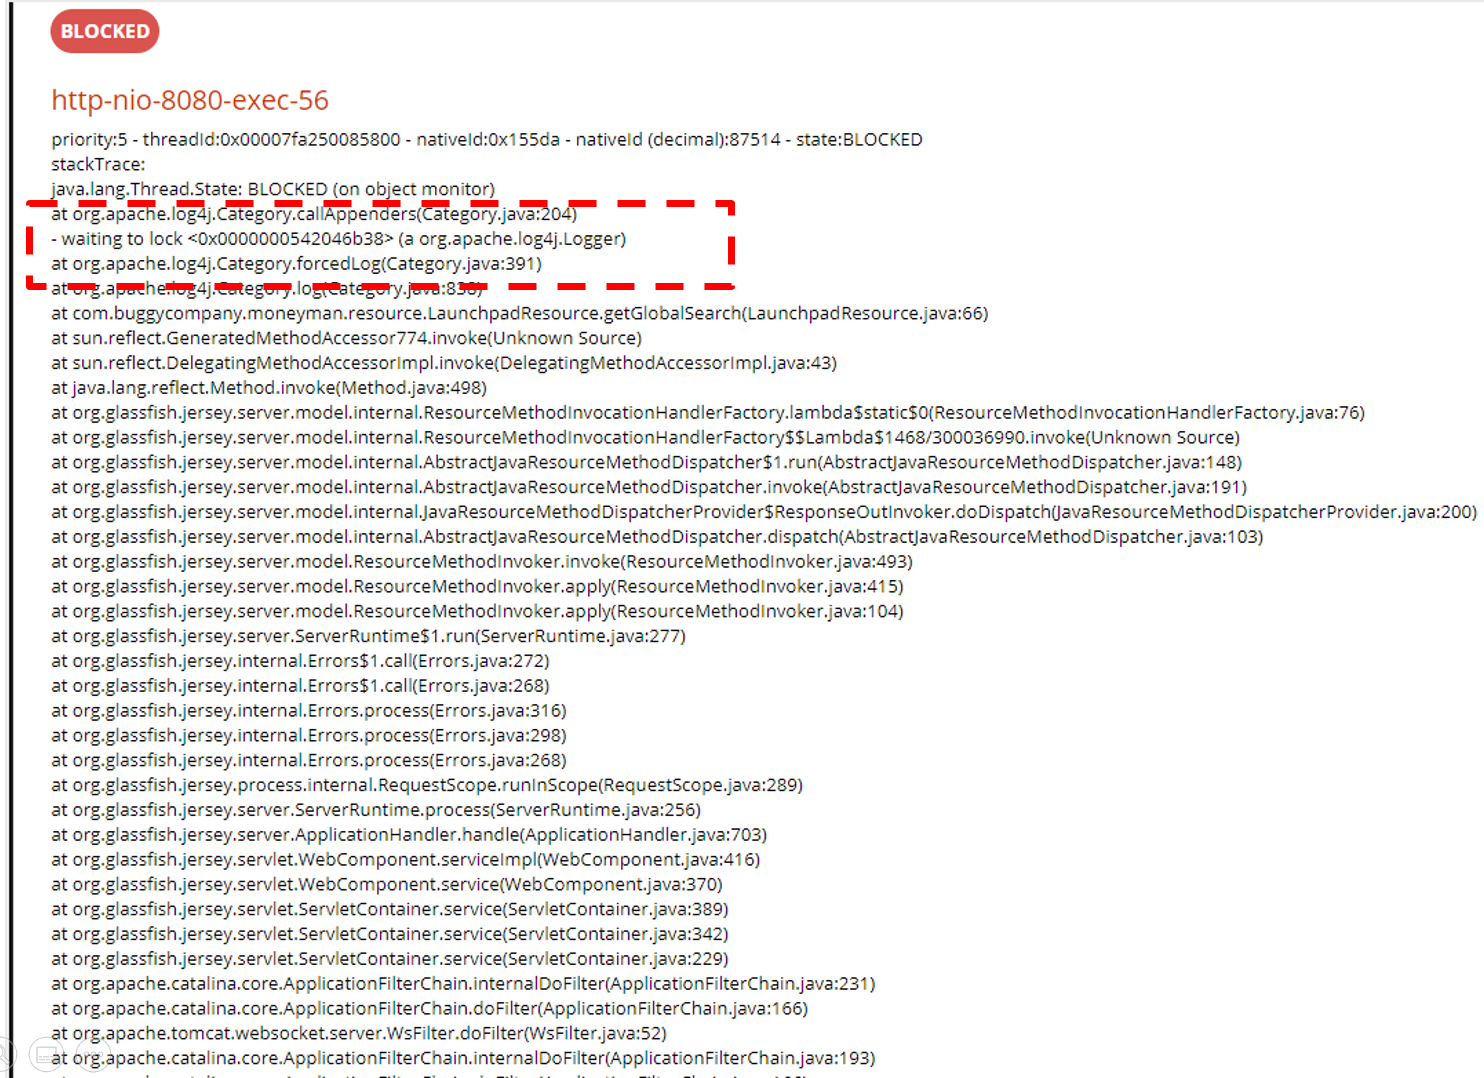
Now let's take a look at the stack trace of 'http-nio-8080-exec-56' thread (one of the 134 threads which were BLOCKED):

Take a look at the highlighted section of the above stack trace. It's waiting to acquire org.apache.log4j.Logger lock. You can see the 'http-nio-8080-exec-56' thread to be in BLOCKED state, because 'http-nio-8080-exec-114' acquired org.apache.log4j.Logger lock and didn't release it.
Remaining all 134 threads were also stuck waiting for the 'org.apache.log4j.Logger' lock. Thus whenever an application thread attempted to log, it got into this BLOCKED state. Thus 134 application threads ended into this BLOCKED state.
We then googled for org.apache.log4j.Logger BLOCKED thread. We stumbled upon this interesting defect reported in the Apache Log4j bug database.
It turned out that this is one of the known bugs in the Log4J framework, and it's one of the primary reasons why the new Log4j2 framework was developed. Below is the interesting excerpt from this defect description:
<<code:start>>
There is no temporary fix for this issue and is one of the reasons Log4j 2 came about. The only fix is to upgrade to Log4j 2.
Yes, I am saying that the code in Log4j 2 is much different and locking is handled much differently. There is no lock on the root logger or the appender loop.
<<code:end>>
Due to the bug, any thread which was trying to log got into the BLOCKED state. It caused the entire application to come to a grinding halt. Once the application was migrated from Log4j to the Log4j2 framework, the problem got resolved.
Conclusion
1. Log4j2 isn't just the next version of the Log4j framework; it's a new framework written from scratch. It has a lot of bug fixes and performance improvements. If your application is using the Log4J framework, we highly recommended upgrading to the apache Log4j2 framework. Here is the migration guide.
2. Also, now you were able to learn how to troubleshoot an unresponsive application.
Further Reading
Logging With Log4j in Java
7 Common Web Application Performance Problems (and How to Solve Them)

