Load Balancer High Availability With CockroachDB and HAProxy
For reference: Checkout my previous article where I discuss connection pool high availability, "Connection Pool High Availability With CockroachDB and PgCat."
Motivation
The load balancer is a core piece of architecture for CockroachDB. Given its importance, I'd like to discuss the methods to overcome the SPOF scenarios.
High-Level Steps
- Start CockroachDB and HAProxy in Docker
- Run a workload
- Demonstrate fault tolerance
- Conclusion
Step-By-Step Instructions
Start CockroachDB and HAProxy in Docker
I have a Docker Compose environment with all of the necessary services here. Primarily, we are adding a second instance of HAProxy and overriding the ports not to overlap with the existing load balancer in the base Docker Compose file.
I am in the middle of refactoring my repo to remove redundancy and decided to split up my Compose files into a base docker-compose.yml and any additional services into their own YAML files.
  lb2:
    container_name: lb2
    hostname: lb2
    build: haproxy
    ports:
      - "26001:26000"
      - "8082:8080"
      - "8083:8081"
    depends_on:
      - roach-0
      - roach-1
      - roach-2
To follow along, you must start the Compose environment with the command:
docker compose -f docker-compose.yml -f docker-compose-lb-high-availability.yml up -d --build
You will see the following list of services:
  Network cockroach-docker_default  Created                                                                                 0.0s
  Container client2                 Started                                                                                 0.4s
  Container roach-1                 Started                                                                                 0.7s
  Container roach-0                 Started                                                                                 0.6s
  Container roach-2                 Started                                                                                 0.5s
  Container client                  Started                                                                                 0.6s
  Container init                    Started                                                                                 0.9s
  Container lb2                     Started                                                                                 1.1s
  Container lb                      Started
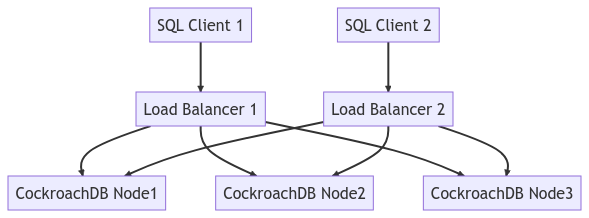
The diagram below depicts the entire cluster topology:
Run a Workload
At this point, we can connect to one of the clients and initialize the workload. I am using tpcc as it's a good workload to demonstrate write and read traffic.
cockroach workload fixtures import tpcc --warehouses=10 'postgresql://root@lb:26000/tpcc?sslmode=disable'
Then we can start the workload from both client containers.
- Load Balancer 1:
cockroach workload run tpcc --duration=120m --concurrency=3 --max-rate=1000 --tolerate-errors --warehouses=10 --conns 30 --ramp=1m --workers=100 'postgresql://root@lb:26000/tpcc?sslmode=disable'
- Load Balancer 2:
cockroach workload run tpcc --duration=120m --concurrency=3 --max-rate=1000 --tolerate-errors --warehouses=10 --conns 30 --ramp=1m --workers=100 'postgresql://root@lb2:26000/tpcc?sslmode=disable'
You will see output similar to this.
  488.0s        0            1.0            2.1     44.0     44.0     44.0     44.0 newOrder
  488.0s        0            0.0            0.2      0.0      0.0      0.0      0.0 orderStatus
  488.0s        0            2.0            2.1     11.0     16.8     16.8     16.8 payment
  488.0s        0            0.0            0.2      0.0      0.0      0.0      0.0 stockLevel
  489.0s        0            0.0            0.2      0.0      0.0      0.0      0.0 delivery
  489.0s        0            2.0            2.1     15.2     17.8     17.8     17.8 newOrder
  489.0s        0            1.0            0.2      5.8      5.8      5.8      5.8 orderStatus
The logs for each instance of HAProxy will show something like this:
192.168.160.1:60584 [27/Apr/2023:14:51:39.927] stats stats/<STATS> 0/0/0 28724 LR 2/2/0/0/0 0/0
192.168.160.1:60584 [27/Apr/2023:14:51:39.927] stats stats/<STATS> 0/0/816 28846 LR 2/2/0/0/0 0/0
192.168.160.1:60584 [27/Apr/2023:14:51:40.744] stats stats/<STATS> 0/0/553 28900 LR 2/2/0/0/0 0/0
192.168.160.1:60584 [27/Apr/2023:14:51:41.297] stats stats/<STATS> 0/0/1545 28898 LR 2/2/0/0/0 0/0
192.168.160.1:60582 [27/Apr/2023:14:51:39.927] stats stats/<NOSRV> -1/-1/61858 0 CR 2/2/0/0/0 0/0
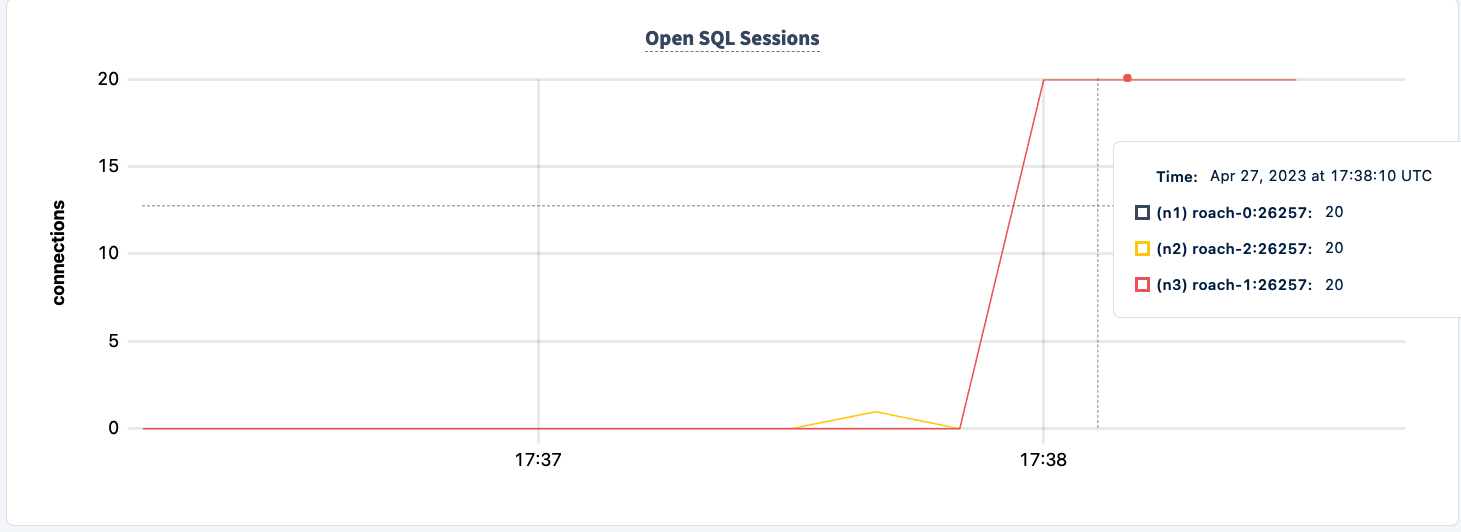
HAProxy exposes a web UI on port 8081. Since we have two instances of HAProxy, I exposed the second instance at port 8083.


Demonstrate Fault Tolerance
We can now start terminating the HAProxy instances to demonstrate failure tolerance. Let's start with instance 1.
docker kill lb
lb
The workload will start producing error messages.
7 17:41:18.758669 357 workload/pgx_helpers.go:79  [-] 60 +                RETURNING d_tax, d_next_o_id]
W230427 17:41:18.758737 357 workload/pgx_helpers.go:123  [-] 61  error preparing statement. name=new-order-1 sql=
W230427 17:41:18.758737 357 workload/pgx_helpers.go:123  [-] 61 +               UPDATE district
W230427 17:41:18.758737 357 workload/pgx_helpers.go:123  [-] 61 +               SET d_next_o_id = d_next_o_id + 1
W230427 17:41:18.758737 357 workload/pgx_helpers.go:123  [-] 61 +               WHERE d_w_id = $1 AND d_id = $2
W230427 17:41:18.758737 357 workload/pgx_helpers.go:123  [-] 61 +               RETURNING d_tax, d_next_o_id unexpected EOF
  142.0s        3            0.0            0.2      0.0      0.0      0.0      0.0 delivery
  142.0s        3            0.0            2.2      0.0      0.0      0.0      0.0 newOrder
  142.0s        3            0.0            0.2      0.0      0.0      0.0      0.0 orderStatus
  142.0s        3            0.0            2.2      0.0      0.0      0.0      0.0 payment
Our workload is still running using the HAProxy 2 connection.
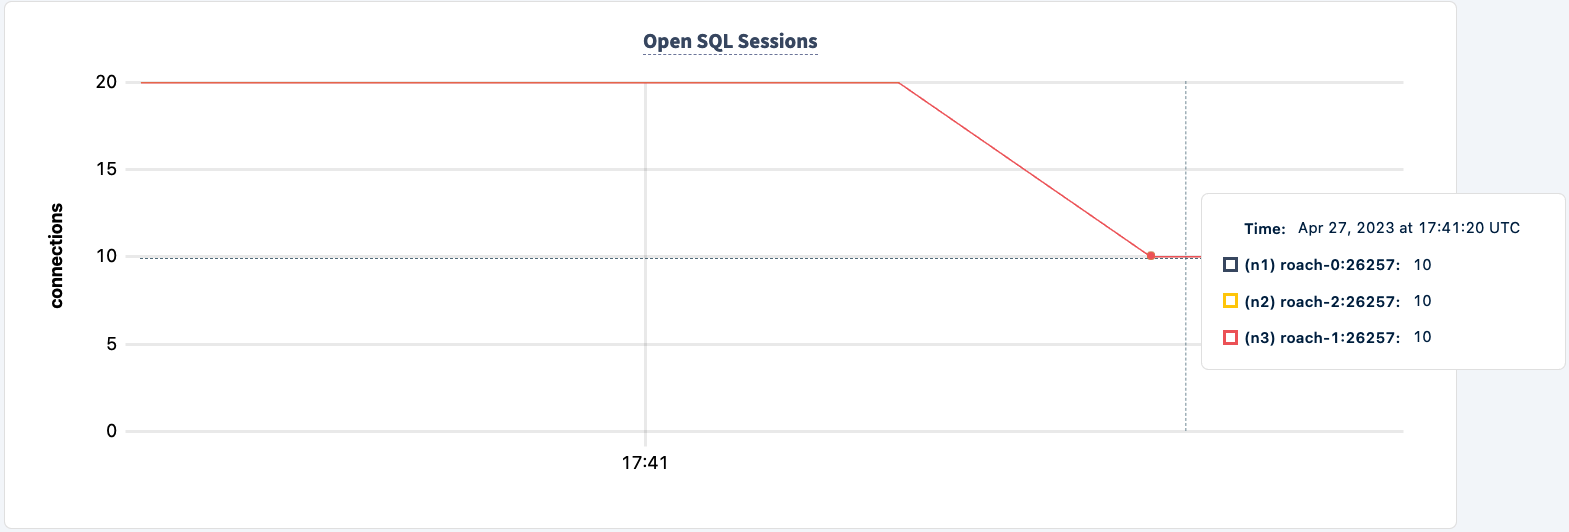

Let's bring it back up:
docker start lb
Notice the client reconnects and continues with the workload.
  335.0s     1780            0.0            0.1      0.0      0.0      0.0      0.0 stockLevel
_elapsed___errors__ops/sec(inst)___ops/sec(cum)__p50(ms)__p95(ms)__p99(ms)_pMax(ms)
  336.0s     1780            0.0            0.1      0.0      0.0      0.0      0.0 delivery
  336.0s     1780            7.0            1.1     19.9     27.3     27.3     27.3 newOrder
  336.0s     1780            0.0            0.1      0.0      0.0      0.0      0.0 orderStatus
  336.0s     1780            2.0            1.0     10.5     11.0     11.0     11.0 payment
  336.0s     1780            0.0            0.1      0.0      0.0      0.0      0.0 stockLevel
  337.0s     1780            0.0            0.1      0.0      0.0      0.0      0.0 delivery
  337.0s     1780            7.0            1.1     21.0     32.5     32.5     32.5 ne
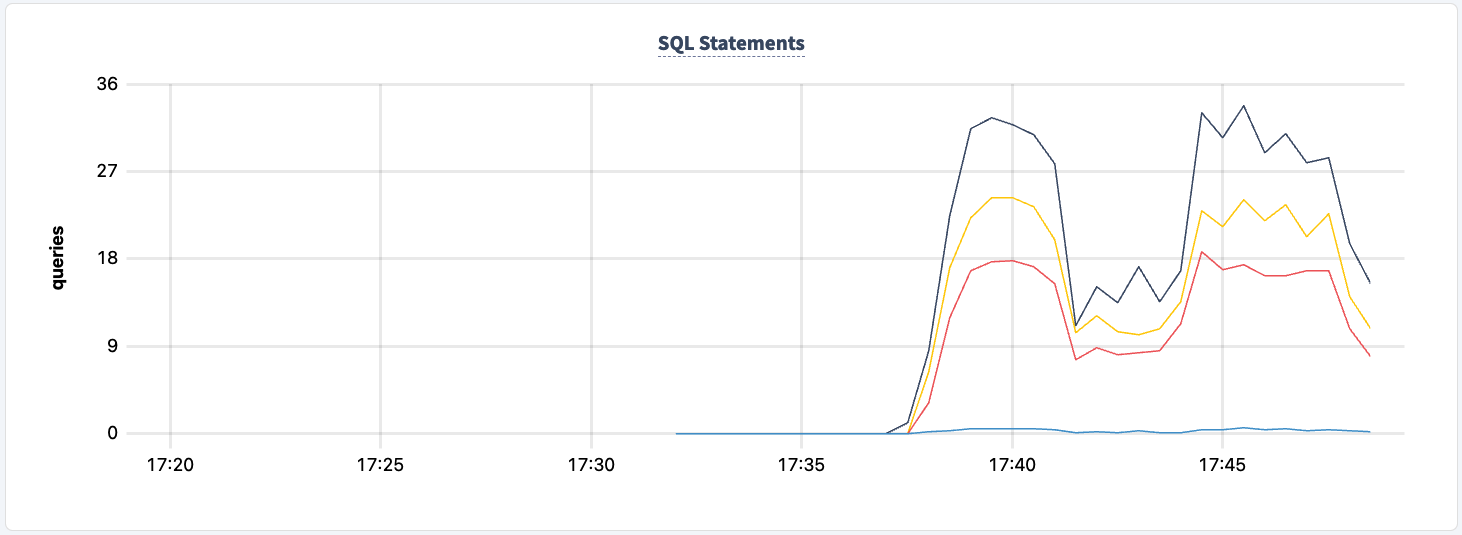
The number of executed statements goes up upon the second client successfully connecting.

We can now do the same with the second instance. Similarly, the workload reports errors that it can't find the lb2 host.
        0.0            0.2      0.0      0.0      0.0      0.0 stockLevel
I230427 17:48:28.239032 403 workload/pgx_helpers.go:79  [-] 188  pgx logger [error]: connect failed logParams=map[err:lookup lb2 on 127.0.0.11:53: no such host]
I230427 17:48:28.267355 357 workload/pgx_helpers.go:79  [-] 189  pgx logger [error]: connect failed logParams=map[err:lookup lb2 on 127.0.0.11:53: no such host]
And we can observe the dip in the statement count.
We can bring it back up:
docker start lb2
One thing we can improve on is starting the workload with both connection strings. It will allow each client to fail back to the other instance of pgurl even when one of the HAProxy instances is down. What we have to do is stop both clients and restart with both connection strings.
cockroach workload run tpcc --duration=120m --concurrency=3 --max-rate=1000 --tolerate-errors --warehouses=10 --conns 30 --ramp=1m --workers=100 'postgresql://root@lb:26000/tpcc?sslmode=disable' 'postgresql://root@lb2:26000/tpcc?sslmode=disable'
I am going to do that one client at a time so that the workload does not exit completely.
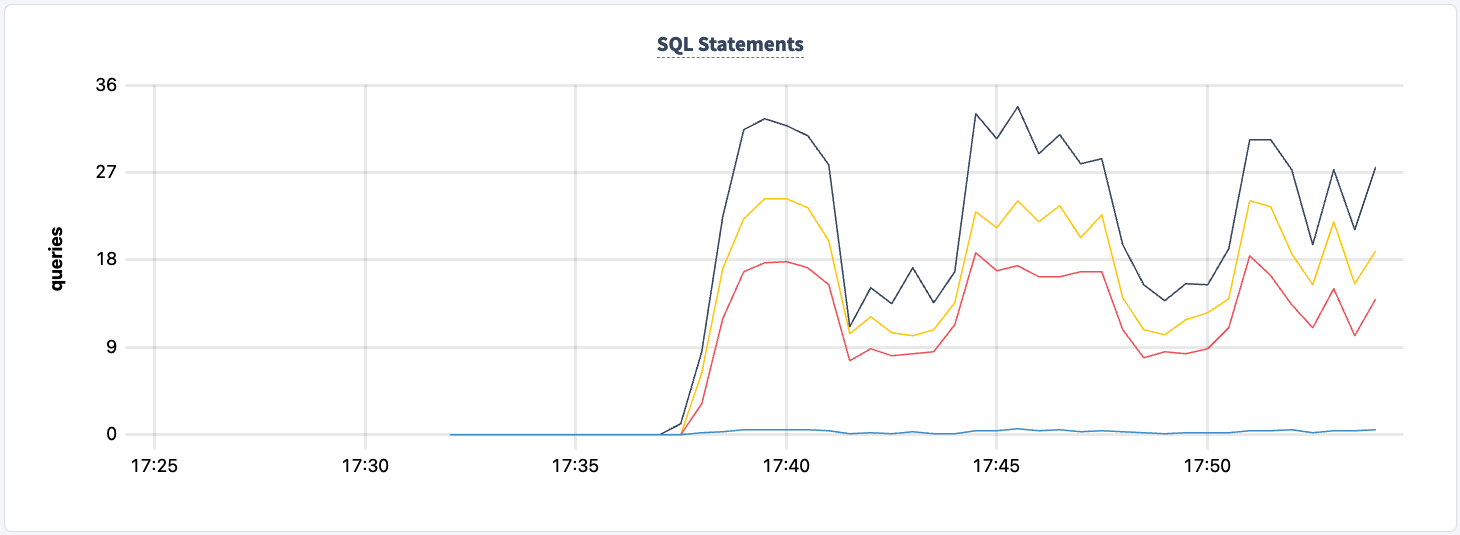
Not at any point in this experiment have we lost the ability to read/write to and from the cluster. Let's shut down one of the HAProxy instances again and see the impact.
docker kill lb
lb
I'm now seeing errors across both clients, but both clients are still executing.
.817268 1 workload/cli/run.go:548  [-] 85  error in stockLevel: lookup lb on 127.0.0.11:53: no such host
_elapsed___errors__ops/sec(inst)___ops/sec(cum)__p50(ms)__p95(ms)__p99(ms)_pMax(ms)
  156.0s       49            0.0            0.2      0.0      0.0      0.0      0.0 delivery
  156.0s       49            1.0            2.1     31.5     31.5     31.5     31.5 newOrder
  156.0s       49            0.0            0.2      0.0      0.0      0.0      0.0 orderStatus
  156.0s       49            1.0            2.0     12.1     12.1     12.1     12.1 payment
  156.0s       49            0.0            0.2      0.0      0.0      0.0      0.0 stockLevel
I230427 17:55:58.558209 354 workload/pgx_helpers.go:79  [-] 86  pgx logger [error]: connect failed logParams=map[err:lookup lb on 127.0.0.11:53: no such host]
I230427 17:55:58.698731 346 workload/pgx_helpers.go:79  [-] 87  pgx logger [error]: connect failed logParams=map[err:lookup lb on 127.0.0.11:53: no such host]
I230427 17:55:58.723643 386 workload/pgx_helpers.go:79  [-] 88  pgx logger [error]: connect failed logParams=map[err:lookup lb on 127.0.0.11:53: no such host]
I230427 17:55:58.726639 370 workload/pgx_helpers.go:79  [-] 89  pgx logger [error]: connect failed logParams=map[err:lookup lb on 127.0.0.11:53: no such host]
I230427 17:55:58.789717 364 workload/pgx_helpers.go:79  [-] 90  pgx logger [error]: connect failed logParams=map[err:lookup lb on 127.0.0.11:53: no such host]
I230427 17:55:58.841283 418 workload/pgx_helpers.go:79  [-] 91  pgx logger [error]: connect failed logParams=map[err:lookup lb on 127.0.0.11:53: no such host]
We can bring it back up and notice the workload recovering.


Conclusion
Throughout the experiment, we've not lost the ability to read and write to the database. There were dips in traffic, but that's expected. The lesson here is providing a highly available configuration where clients can see multiple connections.

