Network Guardians: Crafting a Spring Boot-Driven Anomaly Detection System
We’re going to set out on a mind-blowing tour around network security. Upon considering the nearness and risk posed by cyber threats in this epoch, it is important to prevent the threats so that they do not cause irreversible damage within the network. This three-part article series will take you through the process of developing a network anomaly detection system using the Spring Boot framework in a robust manner. The series is organized as follows:
- Part 1: We’ll concentrate on the foundation and basic structure of our detection system, which has to be created.
- Part 2: The second volume deals with how to assist in controlling the diffusion of sensitive network information as it targets advanced techniques for actively monitoring the network at the present time.
- Part 3: In the last part, machine learning methods will be applied to the developed system, including algorithms, which will increase the system's performance in terms of accuracy and ability to detect anomalies.
By the end of this series, you will have acquired quite a lot of knowledge in developing a strong-based network anomaly detection system using Spring Boot and making use of technologies to improve your organization’s security level.
Step 1: Project Setup
As an initial step in the development of our network anomaly detection system, let's develop a Spring Boot project in which we can make use of all the needed dependencies. In this case, Maven will be our build tool and we will add the following major dependencies:
- Spring Web: For using Spring MVC in the development of web applications
- Spring Data JPA: For easier access to the database and ORM system
- H2 Database: Lightweight in-memory database for development and testing
Let's go ahead and add these important dependencies to our pom.xml file.
<dependency>
	<groupId>org.springframework.boot</groupId>
	<artifactId>spring-boot-starter-web</artifactId>
</dependency>

<dependency>
	<groupId>org.springframework.boot</groupId>
	<artifactId>spring-boot-starter-data-jpa</artifactId>
</dependency>

<dependency>
	<groupId>javax.persistence</groupId>
	<artifactId>javax.persistence-api</artifactId>
	<version>2.2</version>
</dependency>

<dependency>
	<groupId>com.h2database</groupId>
	<artifactId>h2</artifactId>
	<scope>runtime</scope>
</dependency>
Step 2: Model the Network Data
Let's proceed to define our core data model. This crucial component will serve as the foundation for capturing and structuring essential information from our network traffic.
package com.cyber.sreejith.anomaly.network.model;
import java.time.Instant;
import jakarta.persistence.*;

@Entity
@Table(name = "network_data")
public class NetworkData {

    @Id
    @GeneratedValue(strategy = GenerationType.IDENTITY)
    private Long id;

    @Column(name = "source_ip", nullable = true)
    private String sourceIp;

    @Column(name = "destination_ip", nullable = true)
    private String destinationIp;

    @Column(name = "protocol", nullable = true)
    private String protocol;

    @Column(name = "packet_size", nullable = false)
    private int packetSize;

    @Column(name = "timestamp", nullable = true)
    private Instant timestamp;

    @Column(name = "packetLoss", nullable = false)
    private double packetLoss;

    @Column(name = "throughput", nullable = false)
    private double throughput;

    @Column(name = "latency", nullable = false)
    private double latency;

    @Column(name = "anomaly", nullable = false)
    private boolean anomaly;

    public NetworkData() {}

    public NetworkData(String sourceIp, String destinationIp, String protocol, int packetSize, Instant timestamp) {
        this.sourceIp = sourceIp;
        this.destinationIp = destinationIp;
        this.protocol = protocol;
        this.packetSize = packetSize;
        this.timestamp = timestamp;
    }

    public NetworkData(String sourceIp, String destinationIp, int packetSize, Instant timestamp) {
        this.sourceIp = sourceIp;
        this.destinationIp = destinationIp;
        this.packetSize = packetSize;
        this.timestamp = timestamp;
    }

    public NetworkData(String sourceIp, String destinationIp, int packetSize) {
        this.sourceIp = sourceIp;
        this.destinationIp = destinationIp;
        this.packetSize = packetSize;
    }

   //Removed setter/getters/toString for brevity

}
Step 3: Core Detection Engine
Let us now direct our attention to building the heart of this system, which is the tool that will handle and analyze network traffic structures. This important unit will use specific algorithms to carry out the normal operations of searching for patterns in the collected network packets and spotting irregular ones that suggest possible threats. Saving this engine in this way will enable it to perform efficiently even when dealing with high data traffic.
Orchestrate the Detection
The anomaly detection system has been designed with a working module that incorporates a comprehensive function to supervise the whole process of detection. Through this multipronged strategy, a large number of parallelized algorithms are integrated, allowing analysis of the system’s real-time security effectiveness against a much wider perspective of even possible attacks.
	public boolean detectAnomaly(NetworkData data) {
		updateStats(data);

		return isPacketSizeAnomaly(data) || isUnknownProtocol(data) ||
isHighPacketRate(data) || isSuspiciousPort(data) || isUnusualTimestamp(data);
	}
Update Packet Statistics
This function first updates our model with respect to the most recent network data followed by empirical analysis of this data based on several anomaly criteria using boolean logic.
	private void updateStats(NetworkData data) {
		String sourceIp = data.getSourceIp();
		ipStats.putIfAbsent(sourceIp, new PacketStats());
		PacketStats stats = ipStats.get(sourceIp);
		stats.addPacket(data.getTimestamp());
	}
Packet Size Anomaly
The function returns true if such packet size departs from these limits (i.e., is either too large or too small), signifying a possibility of an anomaly. This simple boolean check eliminates millions of packets that fall outside normal bounds, which can imply all sorts of wrong activities or problems on the network, including DoS or DDoS, data leakage, fragmentation, and configuration errors. In filling this function into our broader anomaly detection scheme, we improve the chances of our system promptly raising an alarm over suspicious network traffic handling, which may be investigated or answered in an automated manner.
    private static final int MAX_PACKET_SIZE = 10000;
	private static final int MIN_PACKET_SIZE = 20;

	private boolean isPacketSizeAnomaly(NetworkData data) {
		return data.getPacketSize() > MAX_PACKET_SIZE || data.getPacketSize() < MIN_PACKET_SIZE;
	}
Protocol Anomaly
This code establishes a functional framework for the network traffic protocol. It also has a procedure to raise alerts where any network communication employs the use of protocols other than those that have been flagged. The application provides a means of filtering management of illegal activities or even attempts to conduct illegal network operations.
   private static final Set<String> KNOWN_PROTOCOLS = new HashSet<>(
			Arrays.asList("HTTPS", "SMTP"));

	private boolean isUnknownProtocol(NetworkData data) {
		return !KNOWN_PROTOCOLS.contains(data.getProtocol().toUpperCase());
	}
High Packet Rate
The identified threat function is quite important in preventing network flooding or any Denial of Service (DoS) attack, if any. This function assesses the frequency of packets from a particular IP address by accessing historical files of that source IP and checking the dispersion of packets to the given maximum level of packets defined as the maximum possible. When the rate exceeds this threshold, the rate function returns true as an indication that such traffic is anomalous.
   private boolean isHighPacketRate(NetworkData data) {
		PacketStats stats = ipStats.get(data.getSourceIp());
		return stats.getPacketRate() > MAX_PACKETS_PER_SECOND;
} private class PacketStats {
private Instant firstPacketTime;
private int packetCount;
void addPacket(Instant timestamp) {
if (firstPacketTime == null || Duration.between(firstPacketTime, timestamp).compareTo(TIME_WINDOW) > 0) {
firstPacketTime = timestamp;
packetCount = 1;
} else {
packetCount++;
}
}
double getPacketRate() {
if (firstPacketTime == null) {
return 0.0;
}
Duration duration = Duration.between(firstPacketTime, Instant.now());
long seconds = duration.getSeconds();
if (seconds <= 0) {
return packetCount;
}
return packetCount / (double) seconds;
}
}Suspicious Port
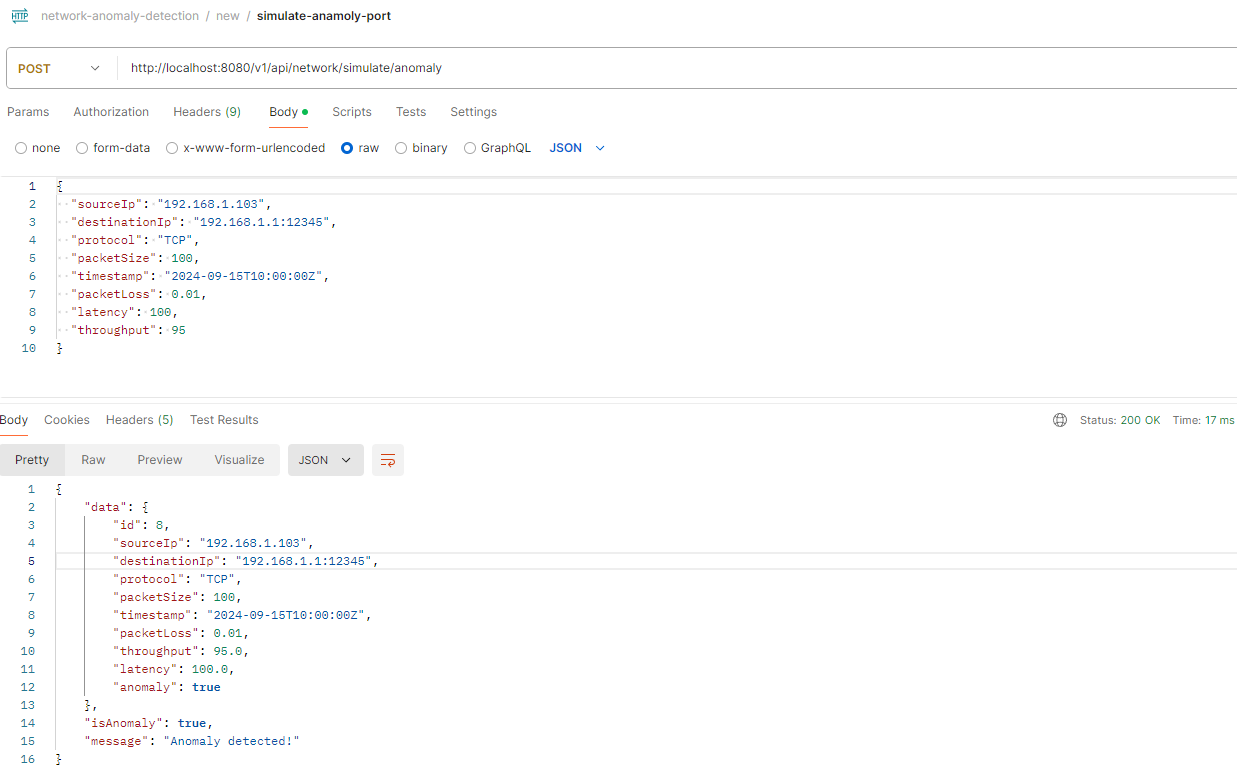
It involves a more granular function for evaluating network connections based on the use of malicious ports. It captures the destination port number from the given NetworkData object and matches it with any of the suspicious ports that are present within a predefined threshold (31337, 12345, 65535). These ports have also been linked to malware, backdoors, and hacking software. Therefore this function helps prevent connecting to such ports which might lead to security breaches, invasion, and malware infection.
private boolean isSuspiciousPort(NetworkData data) {
		// Check for well-known suspicious ports
		int port = extractPort(data.getDestinationIp());
		return port == 31337 || port == 12345 || port == 65535;
}private int extractPort(String ip) {
String[] parts = ip.split(":");
return parts.length > 1 ? Integer.parseInt(parts[1]) : -1;
}
Unusual Timestamp
It carries out this by taking the most likely current time of the operating system and relating it with the time the given NetworkData object was timestamped. If a packet with a NetworkData object is stamped for a future temporal instance, then the function returns true as an indicator of a probable anomalous event.
    private boolean isUnusualTimestamp(NetworkData data) {
		return data.getTimestamp().isAfter(Instant.now());
	}
Step 4: Data Persistence Layer
Let's proceed with implementing our data access layer by creating a repository interface. This interface will leverage the powerful capabilities of Spring Data JPA to streamline our database operations. It can perform basic CRUD operations by extending JpaRepository. We've also added a custom query to retrieve the most recent network data entries. The interface includes a custom query method, which uses the @Query annotation to specify a JPQL query. This method retrieves a specified number of NetworkData entries, ordered by their timestamps in descending order (most recent first).
@Repository
public interface NetworkDataRepository extends JpaRepository<NetworkData, Long> {
    @Query(value = "SELECT n FROM NetworkData n ORDER BY n.timestamp DESC LIMIT :limit")
    List<NetworkData> findTopNByOrderByTimestampDesc(@Param("limit") int limit);
}
This saveNetworkData method is a data persistence operation within our network anomaly detection system. It takes a NetworkData object as input and utilizes the networkDataRepository to save this data to the database.
public NetworkData saveNetworkData(NetworkData data) {
		return networkDataRepository.save(data);
	}
The getRecentNetworkData method is a key component in our network anomaly detection system, designed to retrieve the most recent network traffic data. It takes an integer parameter limit to specify the number of entries to fetch.
   public List<NetworkData> getRecentNetworkData(int limit) {
		return networkDataRepository.findTopNByOrderByTimestampDesc(limit);
	}
The getAllNetworkData method provides a comprehensive retrieval mechanism for our network traffic data. It utilizes the findAll() method, which is automatically provided by Spring Data JPA. This method fetches all NetworkData entries stored in the database, returning them as a List.
public List<NetworkData> getAllNetworkData() {
		return networkDataRepository.findAll();
}
The deleteAllNetworkData method invokes the deleteAll() operation provided by the networkDataRepository, which is part of Spring Data JPA's standard CRUD operations. This method efficiently removes all NetworkData entries from the database, effectively clearing the entire collection of stored network traffic data.
   public void deleteAllNetworkData() {
		networkDataRepository.deleteAll();
	}
Step 5: Real-Time Network Monitoring
Now, let's create the monitoring class. This will keep a constant eye on our network, collecting data and raising alarms when needed.
Network Monitoring
The below method, scheduled to run every 60 seconds, collects network data, checks for anomalies, logs the results, and saves the data.
    @Scheduled(fixedRate = 60000) // Run every 60 seconds
    public void monitorNetwork() {
        NetworkData data = collectNetworkData();
        boolean isAnomaly = anomalyService.detectAnomaly(data);

        if (isAnomaly) {
        	data.setAnomaly(true);
            logger.warn("Anomaly detected: {}", data);
        } else {
        	data.setAnomaly(false);
            logger.info("Normal network activity: {}", data);
        }

        anomalyService.saveNetworkData(data);
    }
Network Data Collection
The below method simulates the collection of network traffic data in a controlled environment. It creates and populates object with mock values for various network attributes such as source and destination IP addresses, packet size, protocol, packet loss, latency, throughput, and timestamp.
   private NetworkData collectNetworkData() {
        // Simulate network data collection
        NetworkData data = new NetworkData();
        data.setSourceIp("10.0.0.1");
        data.setDestinationIp("10.1.0.100");
        data.setPacketSize(100);
        data.setProtocol("http");
        data.setPacketLoss(Math.random() * 10);  // 0-10% packet loss
        data.setLatency(Math.random() * 200);    // 0-200ms latency
        data.setThroughput(Math.random() * 1000); // 0-1000 Mbps throughput
        data.setTimestamp(Instant.now());
        return data;
    }
Step 6: Simulate Anomaly via REST API
The system includes a REST API, allowing us to simulate anomalies easily. This API provides a user-friendly interface for testing and experimentation. However, in real-world applications, such an API is typically unnecessary. Anomaly detection in real-world scenarios focuses on continuous, real-time network monitoring. Rather than relying on external inputs to trigger anomalies, the system automatically detects unusual patterns as they occur. This approach ensures timely detection and response to potential threats. The REST API, while useful for testing, would not play a central role in production environments. In practice, the system would function autonomously to maintain network security.
Simulate Anomaly
This function simulates a network anomaly check. It takes network data as input and analyzes it to detect any anomalies. After processing, it logs the result, saves the data, and returns a response. The response includes the status of the anomaly, the data itself, and a message that describes the outcome.
@PostMapping("/simulate/anomaly")
    public ResponseEntity<Map<String, Object>> simulateAnamoly(@RequestBody NetworkData data) {
        boolean isAnomaly = anomalyService.detectAnomaly(data);

        if (isAnomaly) {
        	data.setAnomaly(true);
            logger.warn("Anomaly detected: {}", data);
        } else {
        	data.setAnomaly(false);
            logger.info("Normal network activity: {}", data);
        }

        anomalyService.saveNetworkData(data);

        Map<String, Object> response = Map.of(
            "isAnomaly", isAnomaly,
            "data", data,
            "message", isAnomaly ? "Anomaly detected!" : "No anomaly detected."
        );

        return ResponseEntity.ok(response);
    }
Get Recent Data
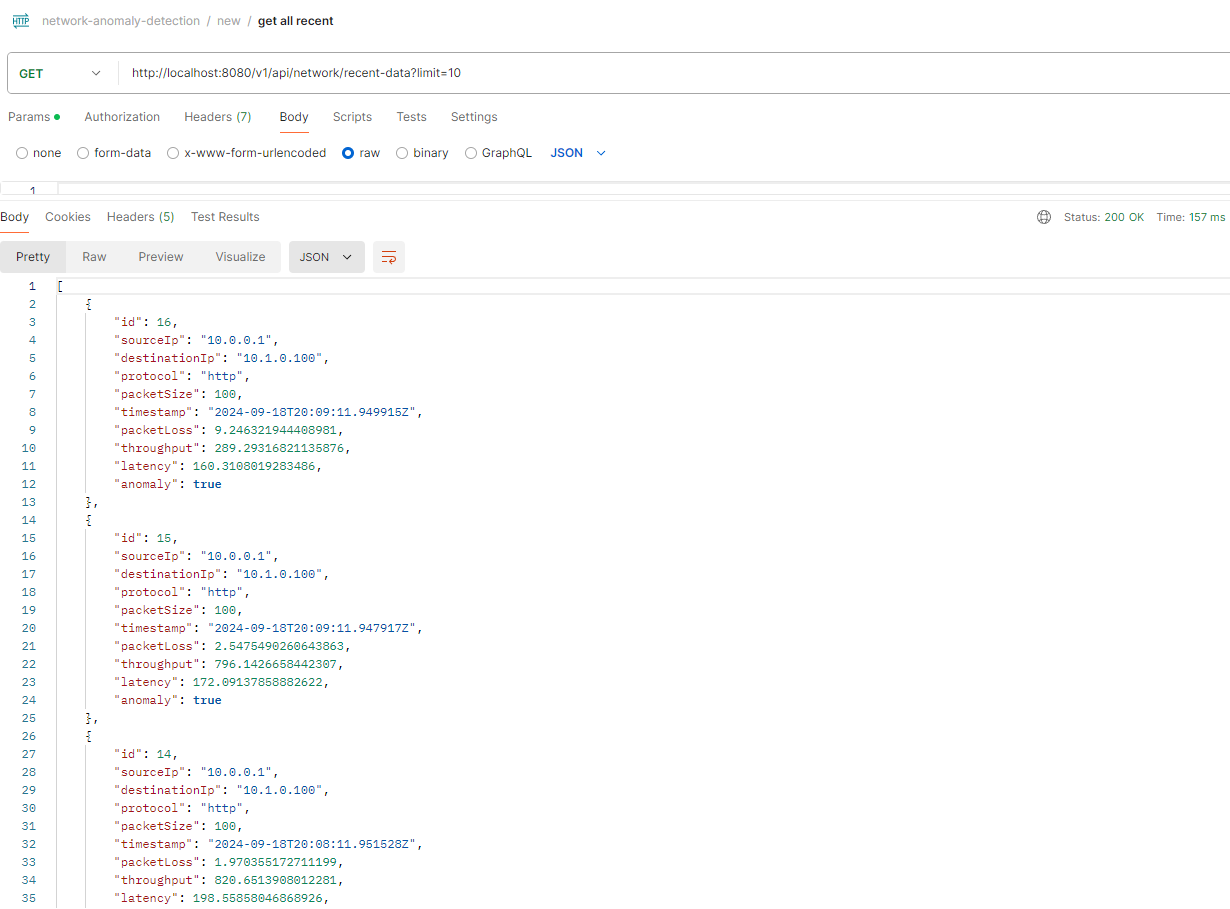
This function retrieves recent network data. It accepts an optional limit parameter (defaulting to 10) to specify the number of recent entries to fetch.
 @GetMapping("/recent-data")
    public ResponseEntity<List<NetworkData>> getRecentData(@RequestParam(defaultValue = "10") int limit) {
        List<NetworkData> recentData = anomalyService.getRecentNetworkData(limit);
        return ResponseEntity.ok(recentData);
    }
Clear Data
This function clears all stored network data. It calls the deleteAllNetworkData method to remove all entries from the database. It returns a confirmation message upon successful deletion.
@DeleteMapping("/clear-data")
    public ResponseEntity<String> clearAllData() {
        anomalyService.deleteAllNetworkData();
        return ResponseEntity.ok("All network data cleared.");
    }
Step 7: Scheduler Configuration
Now let us proceed in configuring our scheduling component, whose role will be to ensure any monitoring work is done in a timely manner. This configuration component utilizes Spring scheduling infrastructure to perform time-critical task management and execution.
Enable Scheduler
This class is a Spring configuration component that serves the purpose of enabling scheduling. It is annotated with @Configuration and @EnableScheduling thus laying down the basic structure of the application for the application’s scheduled tasks
@Configuration
@EnableScheduling
public class SchedulerConfig {

…..
}
Monitor the Network for Each Minute
@Scheduled(fixedRate = 60000) // Run every minute
    public void scheduleNetworkMonitoring() {
        logger.info("Starting scheduled network monitoring task");
        try {
            networkMonitoringService.monitorNetwork();
        } catch (Exception e) {
            logger.error("Error occurred during scheduled network monitoring: ", e);
        }
    }
}
Step 8: Testing
To rigorously test our API's capabilities, we'll employ Postman to emulate various network scenarios:
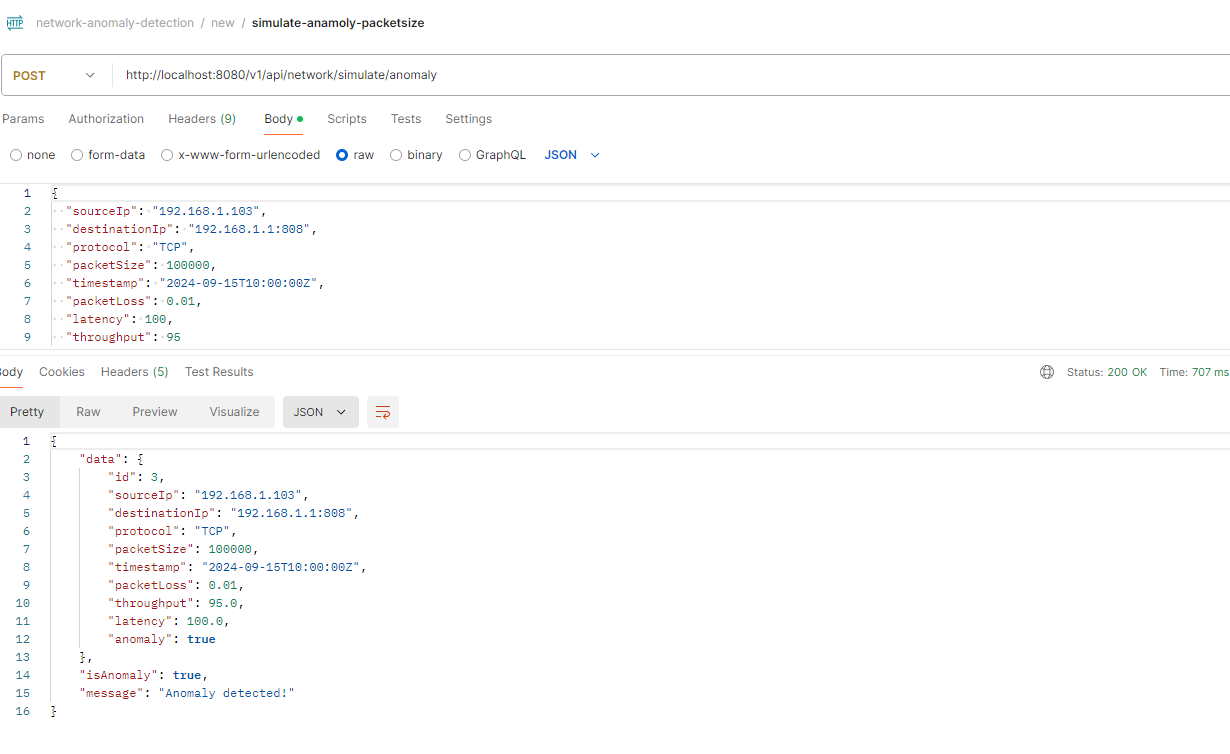
- Increased packet size
- Invalid port in request
Simulate Packet Size Anomaly

Simulate an Invalid Port Anomaly

To retrieve the most recent network activity logs, we can utilize the following API endpoint, which fetches data from our in-memory database.

Conclusion
Using the potent features of Spring Boot and the recommended approaches in network security, a base layout can be created with the aim of securing the network against its dangers. In filling this necessary void, we will improve the system so as to:
- Continuously observe activity on the network.
- Automate the responses to actual or anticipated threats.
- Employ intelligent computational mechanisms to improve detection efficiency.
- Secure the API through the OAuth 2.0 authorization protocol.
- Develop an interactive front-end interface that will allow the user to make sense of the state of the network.
These improvements will be presented in later parts of the guide.

